India on the Rise: Market Outlook & Investment Trends
Analysis as of: 28th March 2025, Pawan
India is surging ahead as one of the world's most dynamic and fastest-growing major economies, brimming with exciting opportunities! While, like any rapidly evolving market, it navigates certain common growth-related considerations, the overall trajectory is undeniably upward. This overview explores the vibrant macroeconomic landscape, stellar market performance, key high-growth sectors, and the typical external factors to consider, all shaping India's brilliant market outlook for 2025 and beyond.
Economic Powerhouse: Growth & Drivers
India's economic engine is firing on all cylinders, with GDP growth projected to maintain an impressive 6-7% for 2025! This remarkable resilience is powered by vibrant domestic demand, a rapidly accelerating digital revolution, and proactive government initiatives like 'Atmanirbhar Bharat' (Self-reliant India) and 'Make in India'.
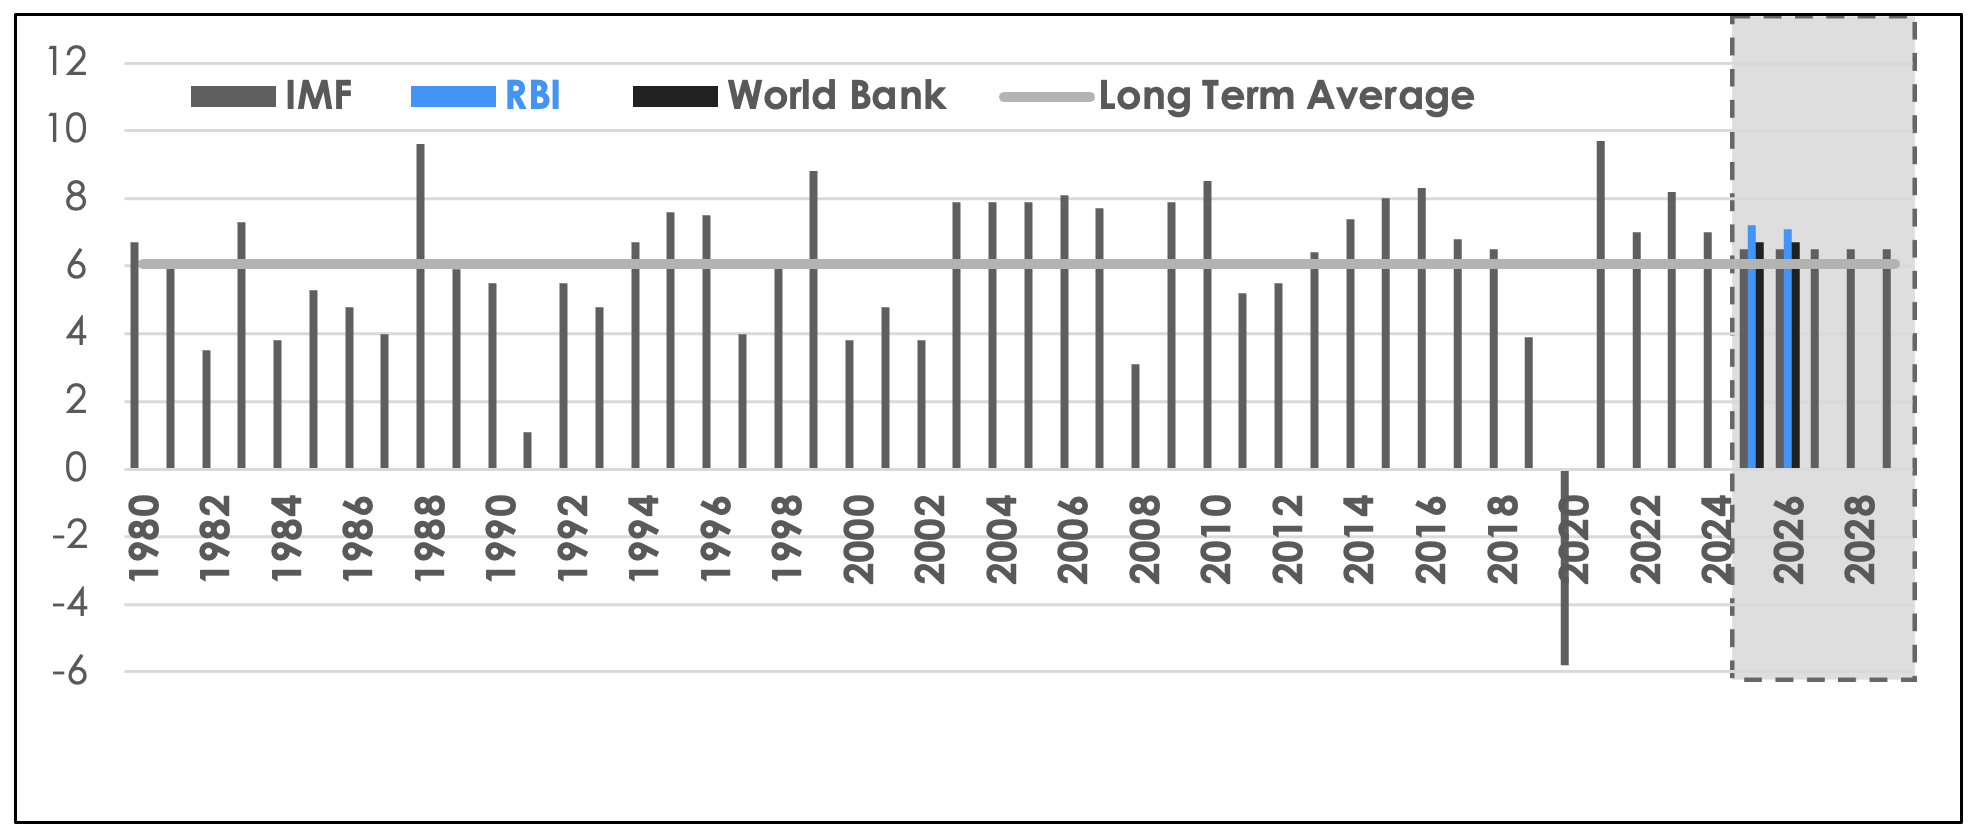
Real GDP growth (Annual % change). Source: IMF, RBI, World Bank
As per World Bank's Long-Term Growth Modeling (LTGM), India's long-term GDP growth rate is projected to stabilize around an encouraging 6.5% by 2035, before gradually maturing to 5.5% by 2050, reflecting economic development and demographic evolution.
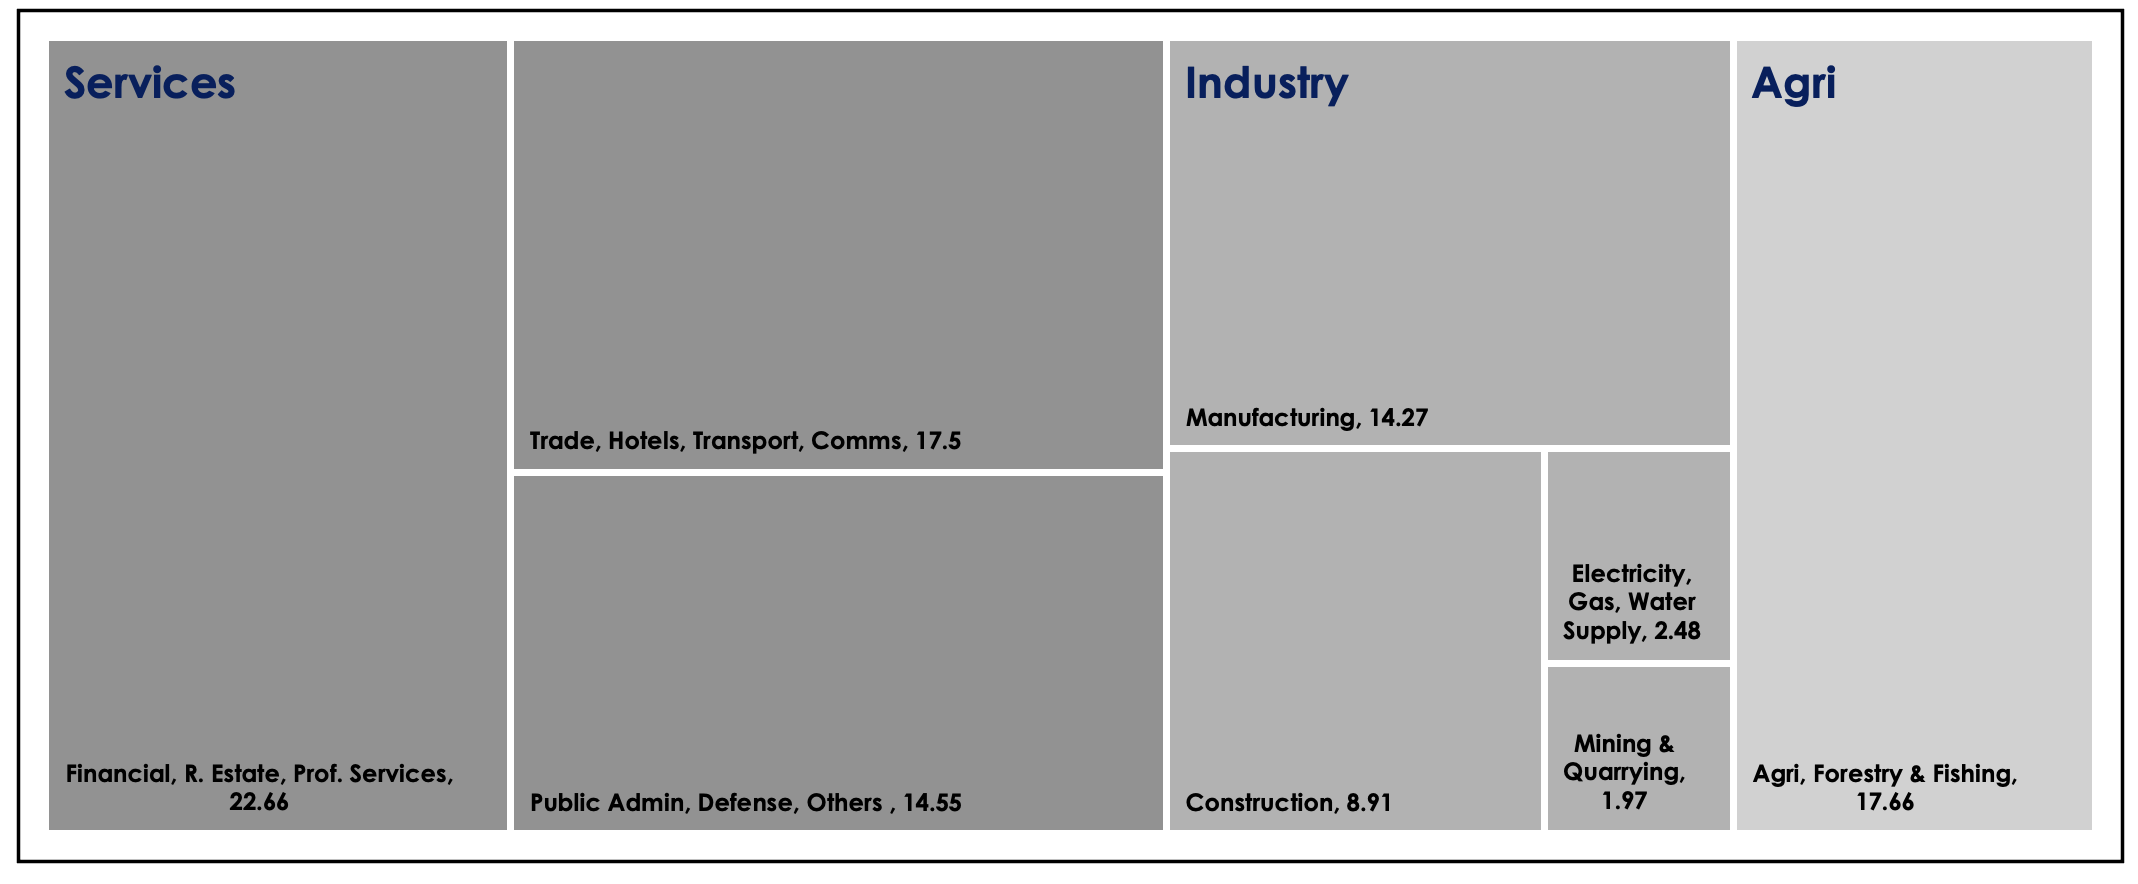
GDP Contribution (2023-2024 %). Source: MoSPI.
The dynamic services sector continues to lead the charge in GDP contribution, particularly Financial Services, Real Estate, and Professional Services. Meanwhile, Manufacturing and Construction are making powerful strides, significantly boosted by strategic infrastructure investments.
Key sectors spearheading this incredible economic momentum include:
- IT & Software Services
- Manufacturing (especially electronics, pharma, automotive)
- Renewable Energy
- Infrastructure Development
- Digital Payments & FinTech
- Pharmaceuticals
Macroeconomic Stability: Inflation, Fiscal Policy & Rates
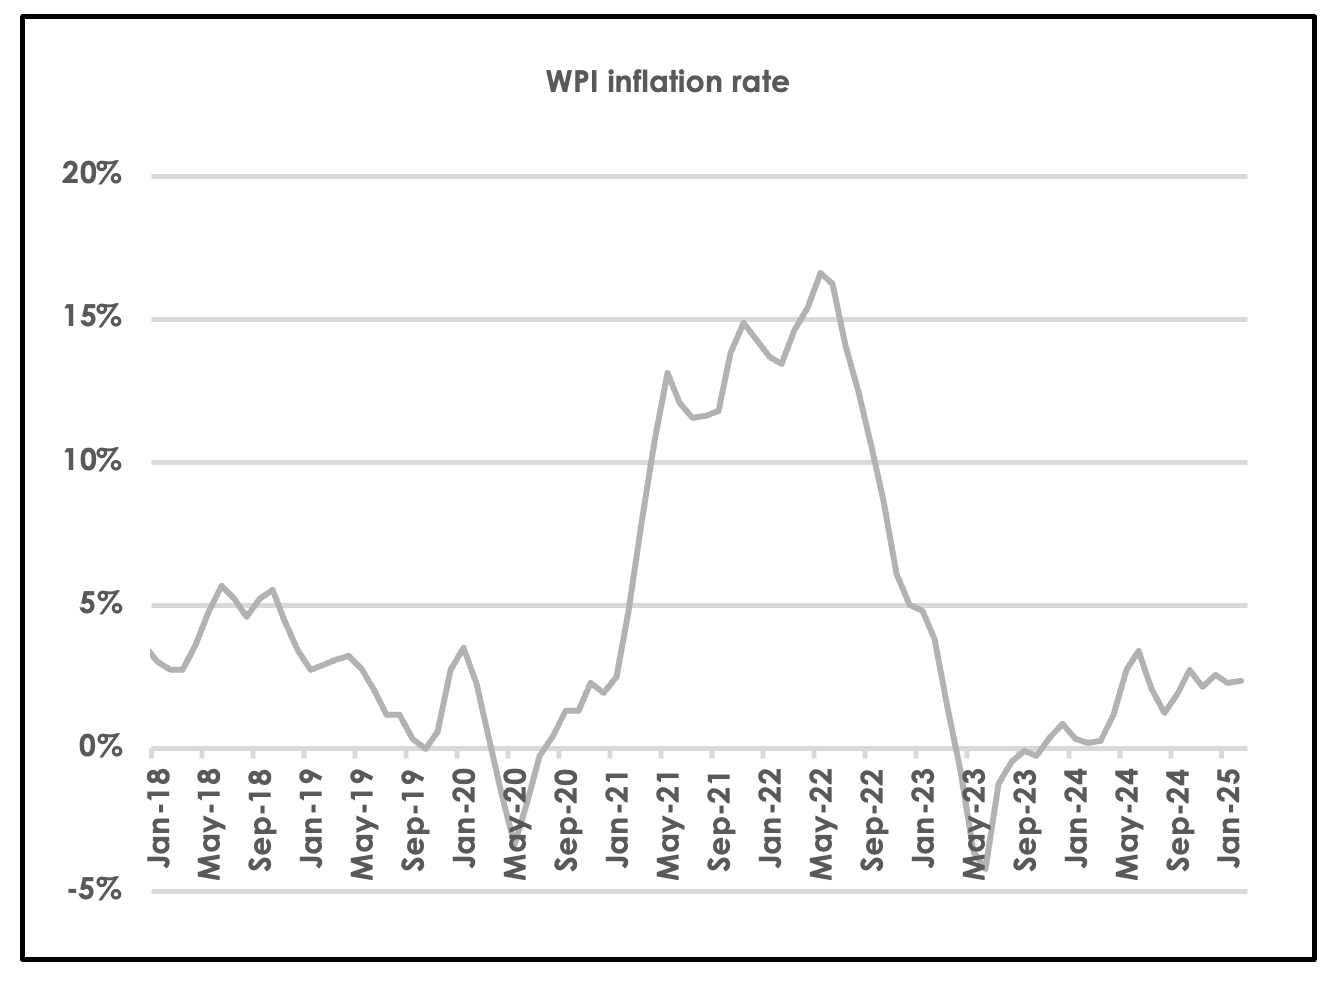
Inflation Trends: The Reserve Bank of India (RBI) is skillfully navigating the inflationary landscape, with both headline and core inflation showing encouraging signs of moderation. This proactive management is laying a strong foundation for sustained growth.
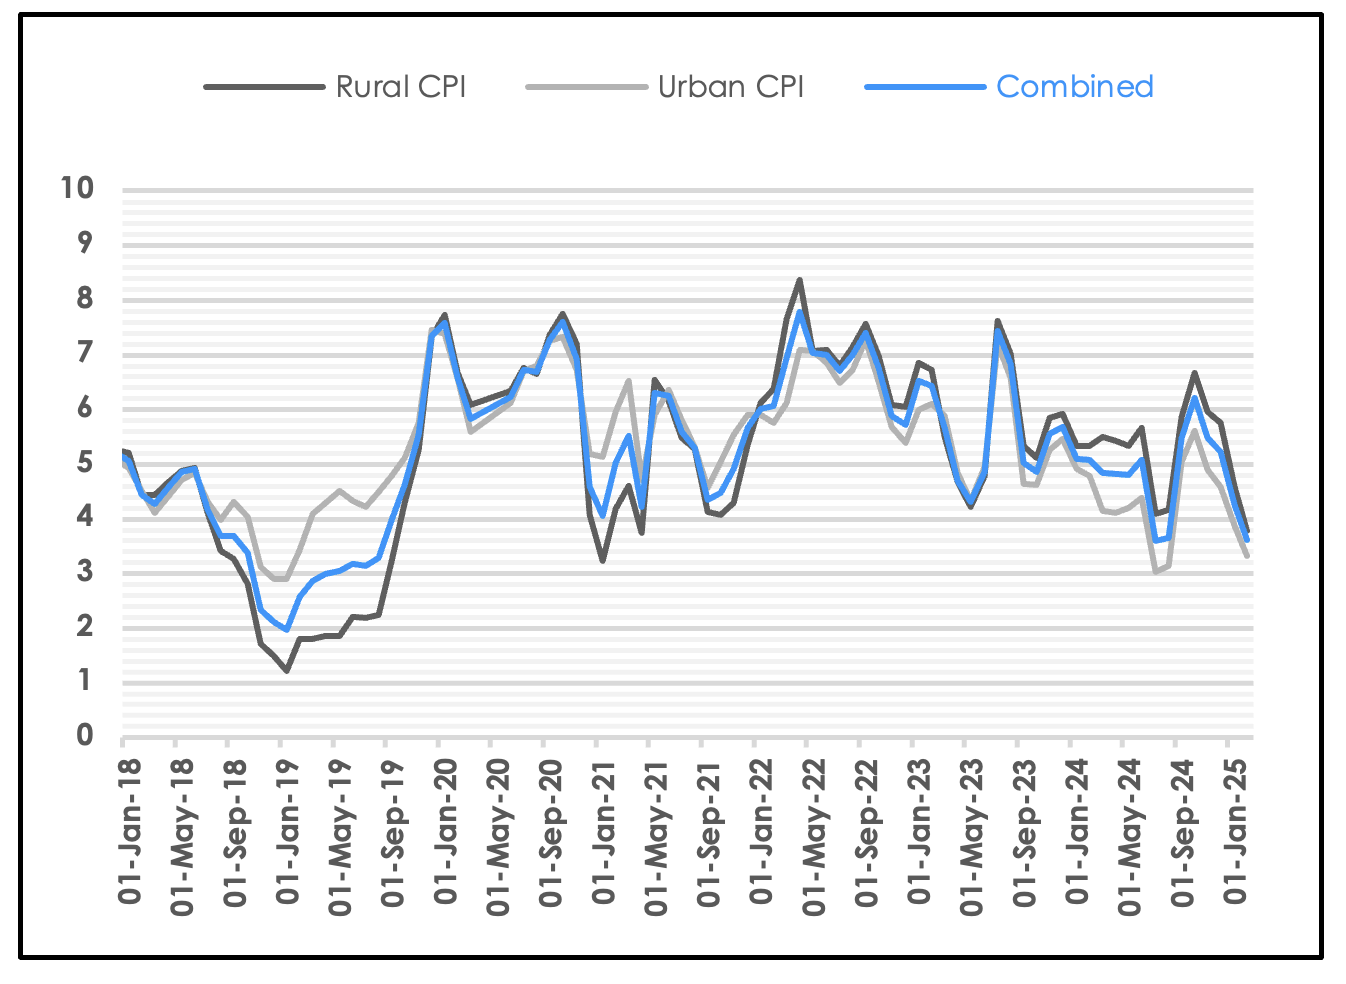
CPI and WPI Inflation Trends. Source: MoSPI, PIB
The Reserve Bank of India (RBI) has projected the Consumer Price Index (CPI) inflation to average a manageable 4.8% for the fiscal year 2024-25 (FY25) and to moderate further to an optimal 4.2% for FY26.
Core vs Headline Inflation Trends. Source: MoSPI, PIB
Interest Rates & RBI Policy Stance:
- Recent Rate Cut:
On February 7, 2025, the Reserve Bank of India (RBI) reduced the repo rate by 25 basis points, bringing it down from 6.50% to 6.25%, aiming to further energize economic growth as inflation eases. - Neutral Policy Stance:
Despite the rate cut, the RBI maintained a 'neutral' policy stance, prudently balancing its focus on ensuring inflation remains comfortably aligned with targets while championing robust growth. - Anticipated Future Rate Cuts:
Market analysts project further rate cuts in 2025, with expectations of an additional 50 basis points reduction by August, as the RBI continues to fine-tune its strategy to optimally balance vibrant growth with stable inflation. - Mid to Long-Term Projections (2027-2031):
While specific forecasts for the RBI's policy rates beyond 2026 are data-dependent, the central bank's actions will undoubtedly be guided by positive factors such as domestic inflation trends, economic growth rates, and global financial conditions, ensuring stability and progress.
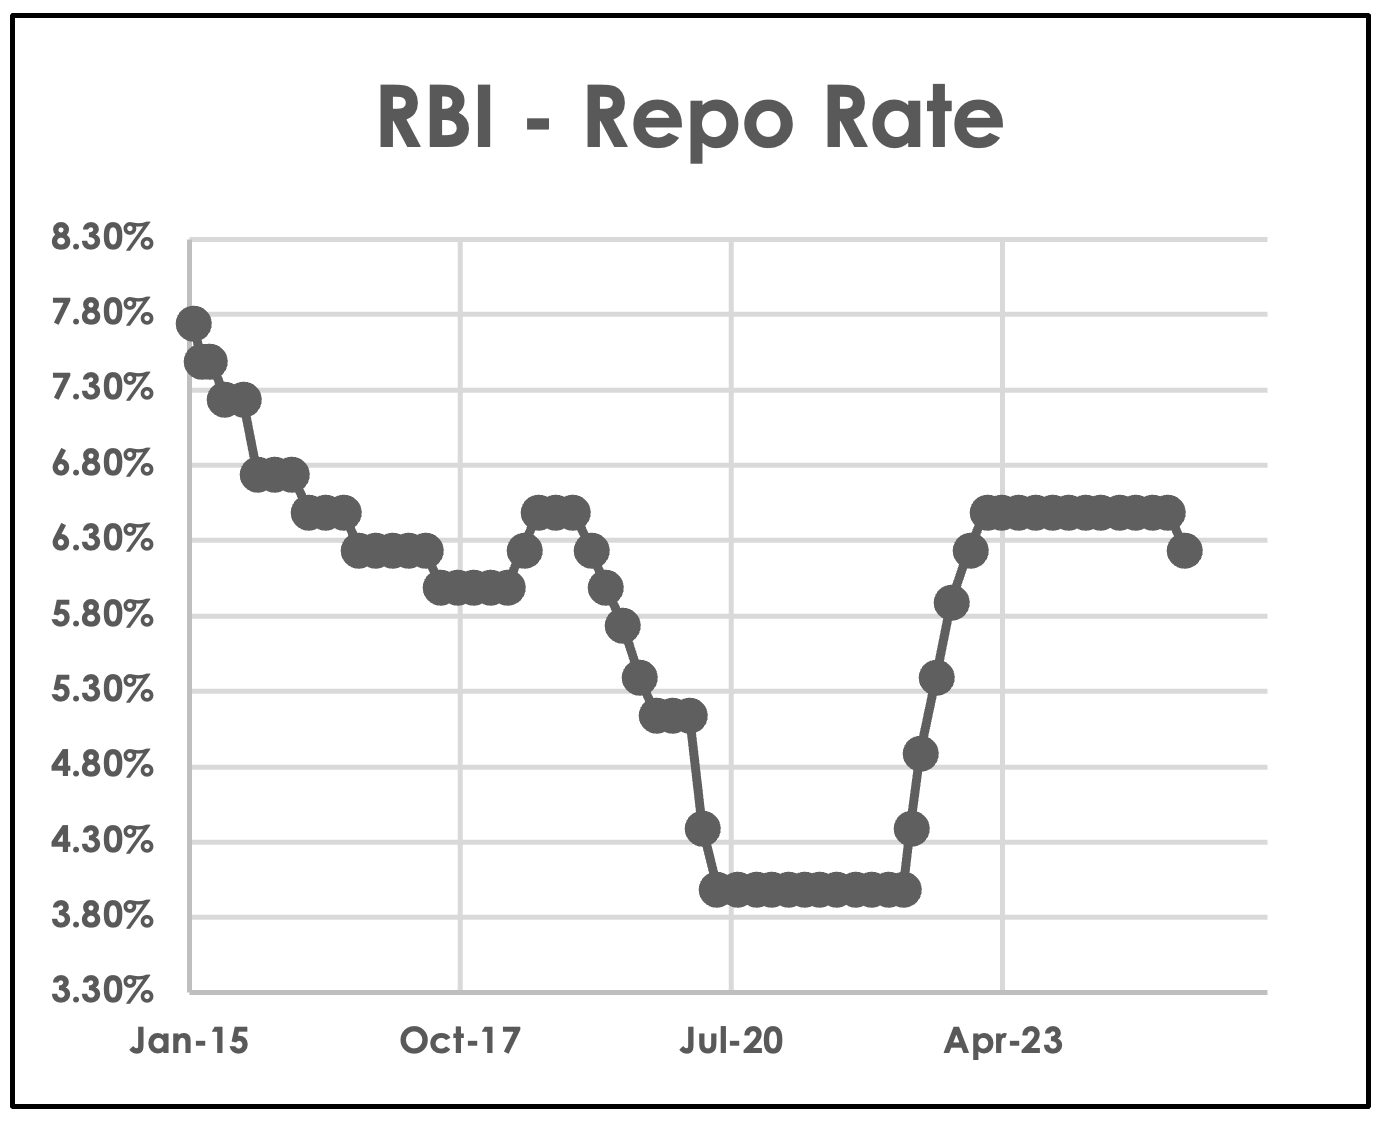
RBI Policy Repo Rate. Source: RBI
Fiscal Deficit & Government Spending:
- Fiscal Deficit Reduction:
The government aims to decrease the fiscal deficit from 4.8% of GDP in FY 2024-25 to an even healthier 4.4% in FY 2025-26, showcasing a strong commitment to prudent fiscal management and long-term stability. - Debt-to-GDP Ratio Goal:
A strategic objective has been set to reduce the central government's debt-to-GDP ratio from 57.1% in FY 2024-25 to a more sustainable 50% by March 2031, paving the way for enhanced long-term fiscal health and resilience.
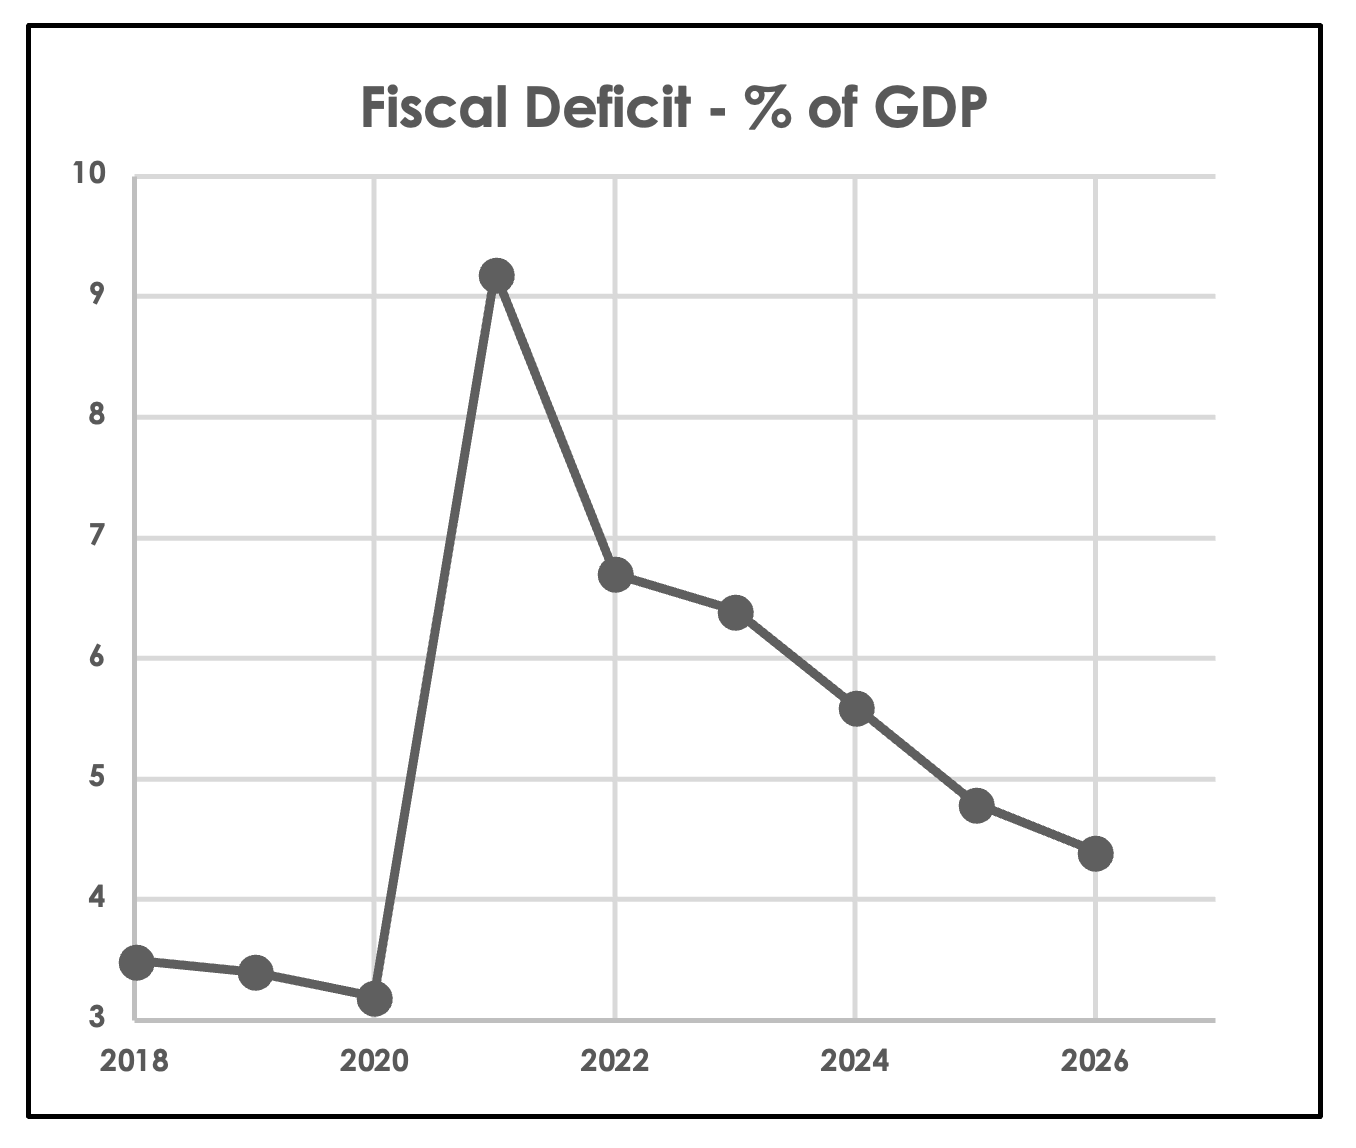
Fiscal Deficit Trajectory (% of GDP). Source: India Budget
Capital Markets: Performance & Volatility - INR Terms
Indian equity markets have showcased impressive strength, delivering robust returns over the medium to long term. While, characteristic of such dynamic growth markets, periods of volatility are natural, the underlying trend has been decidedly positive. In INR terms, major indices like the Nifty 50 and BSE Sensex have shown significant growth. Excitingly, Midcap and Smallcap indices have often led the charge during bull runs, offering significant upside, a common trait accompanied by higher dynamism in these segments.
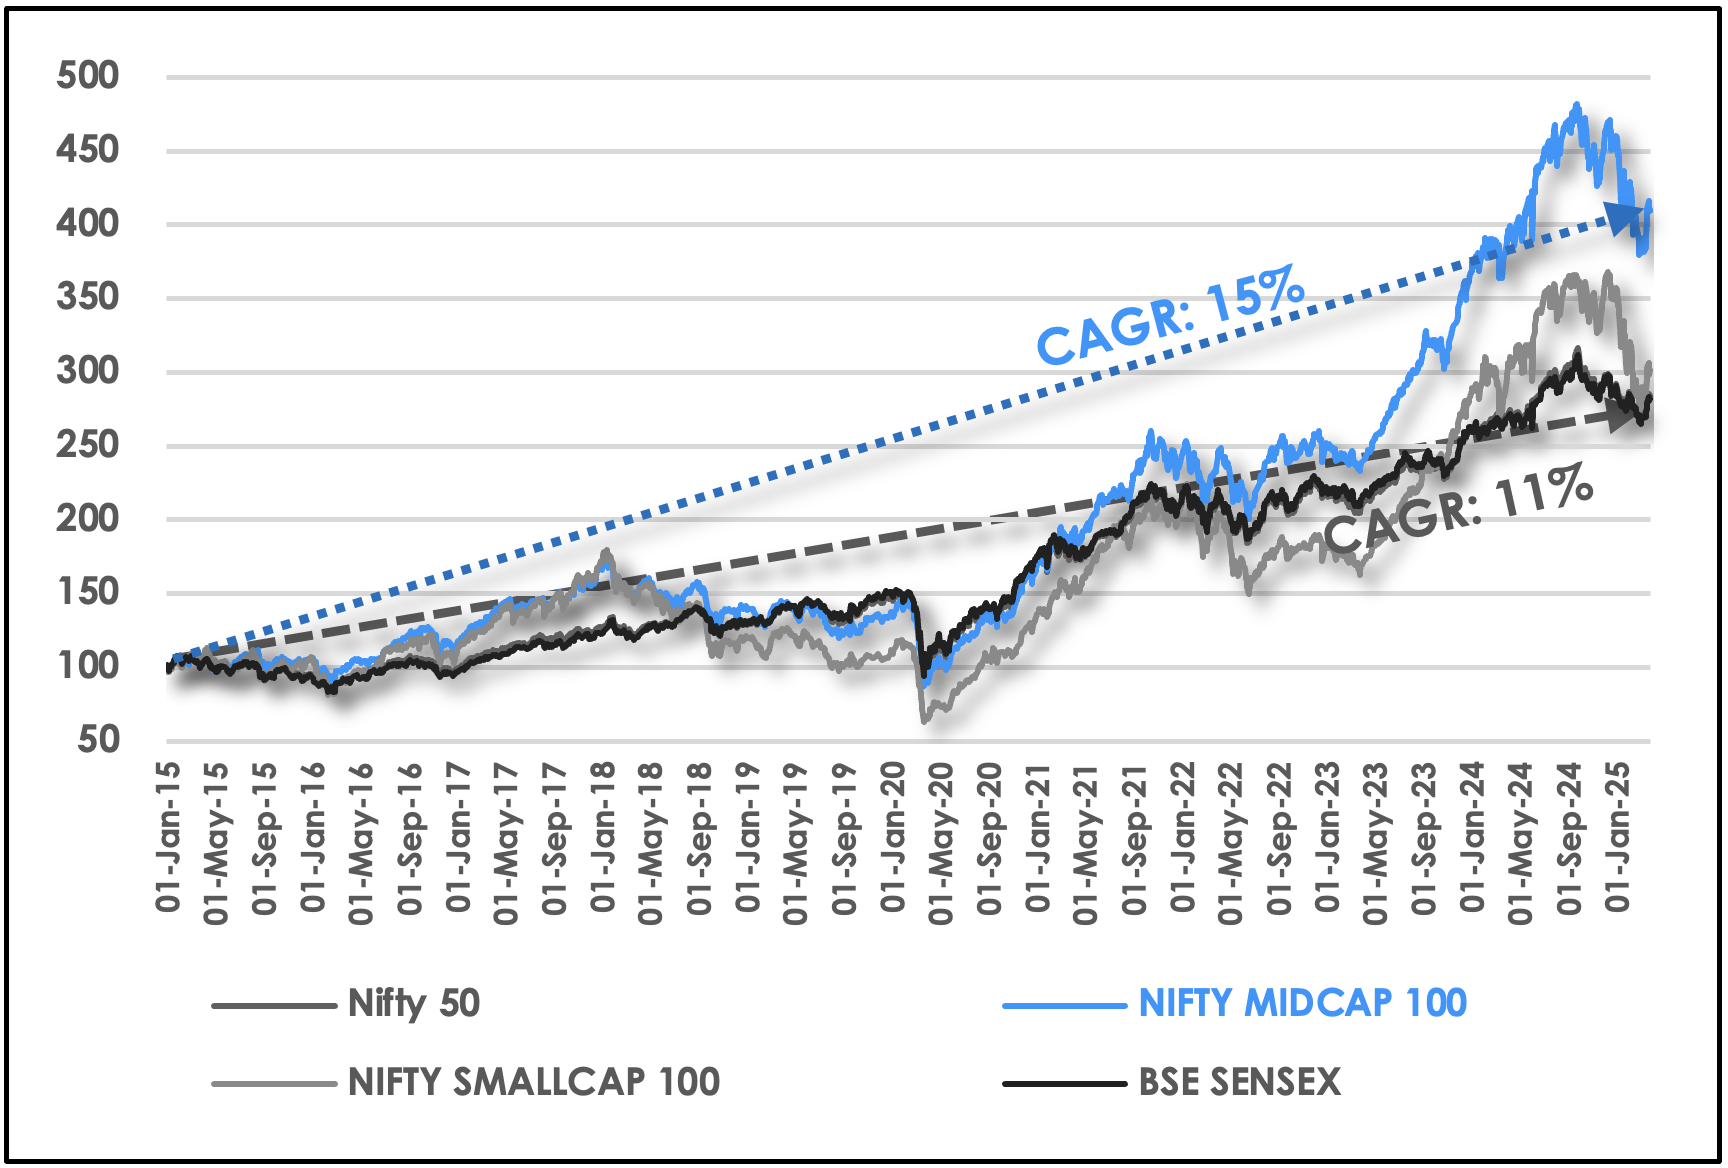
Capital Market Performance INR - Indices (Last 10 Years). Source: Quantwater Analysis
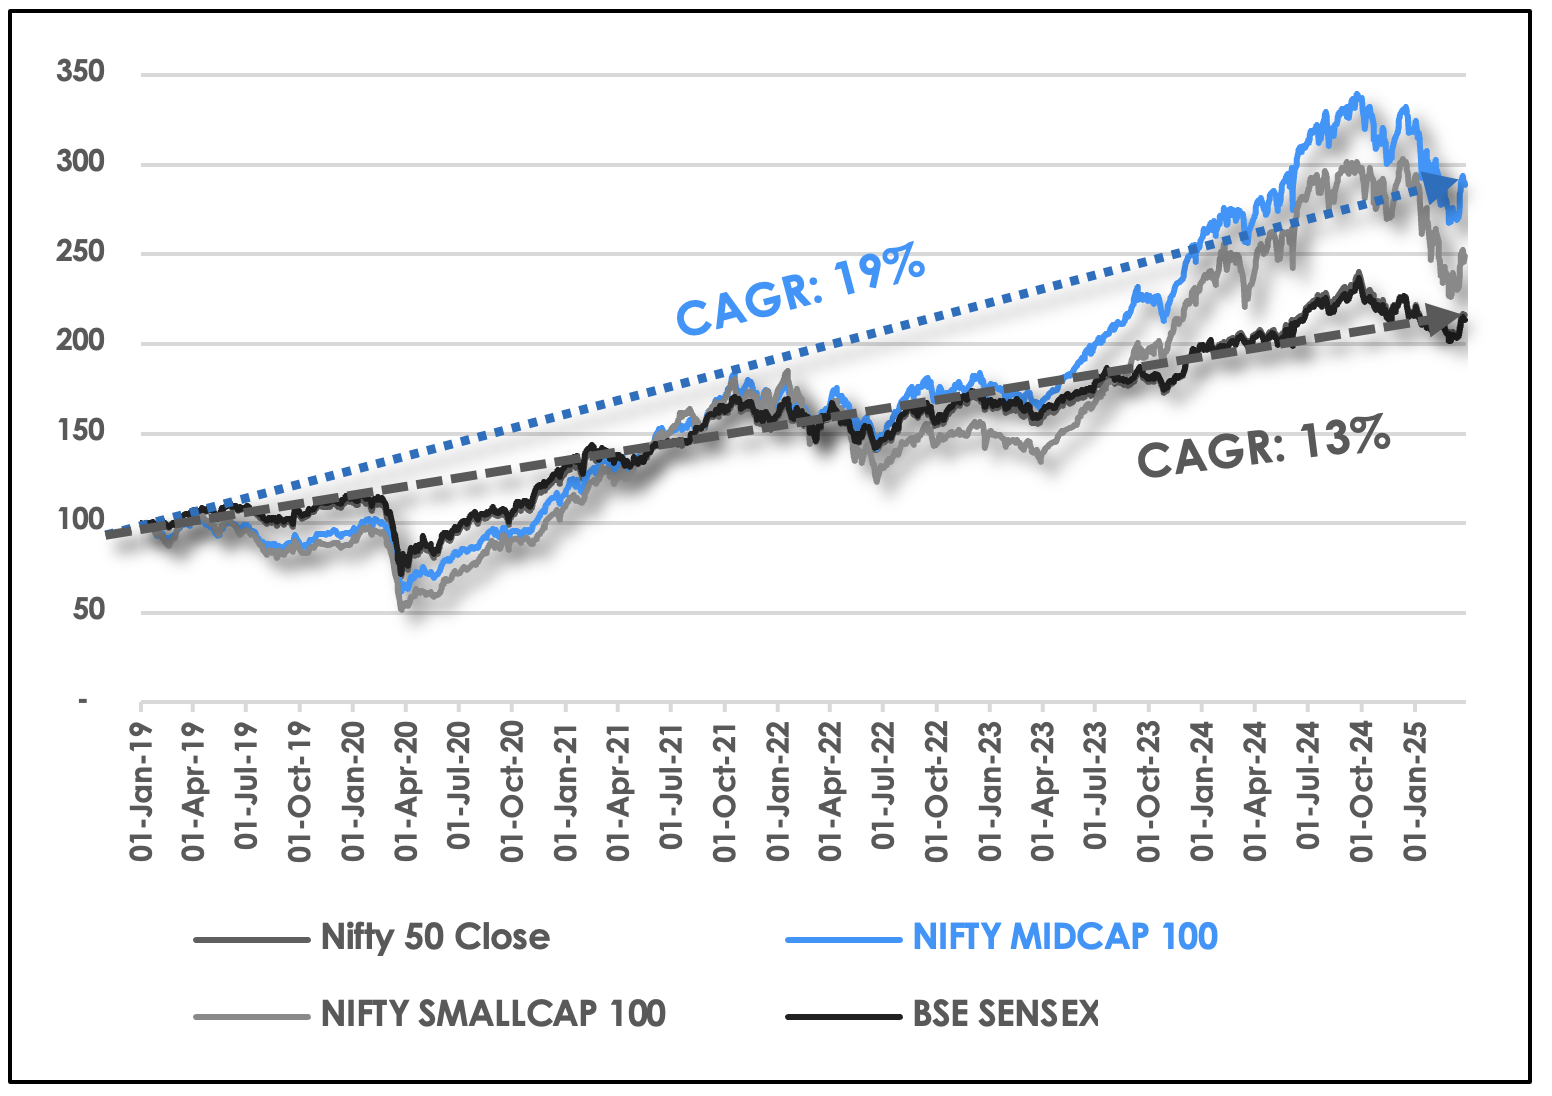
Capital Market Performance INR - Indices (Last 6 Years). Source: Quantwater Analysis
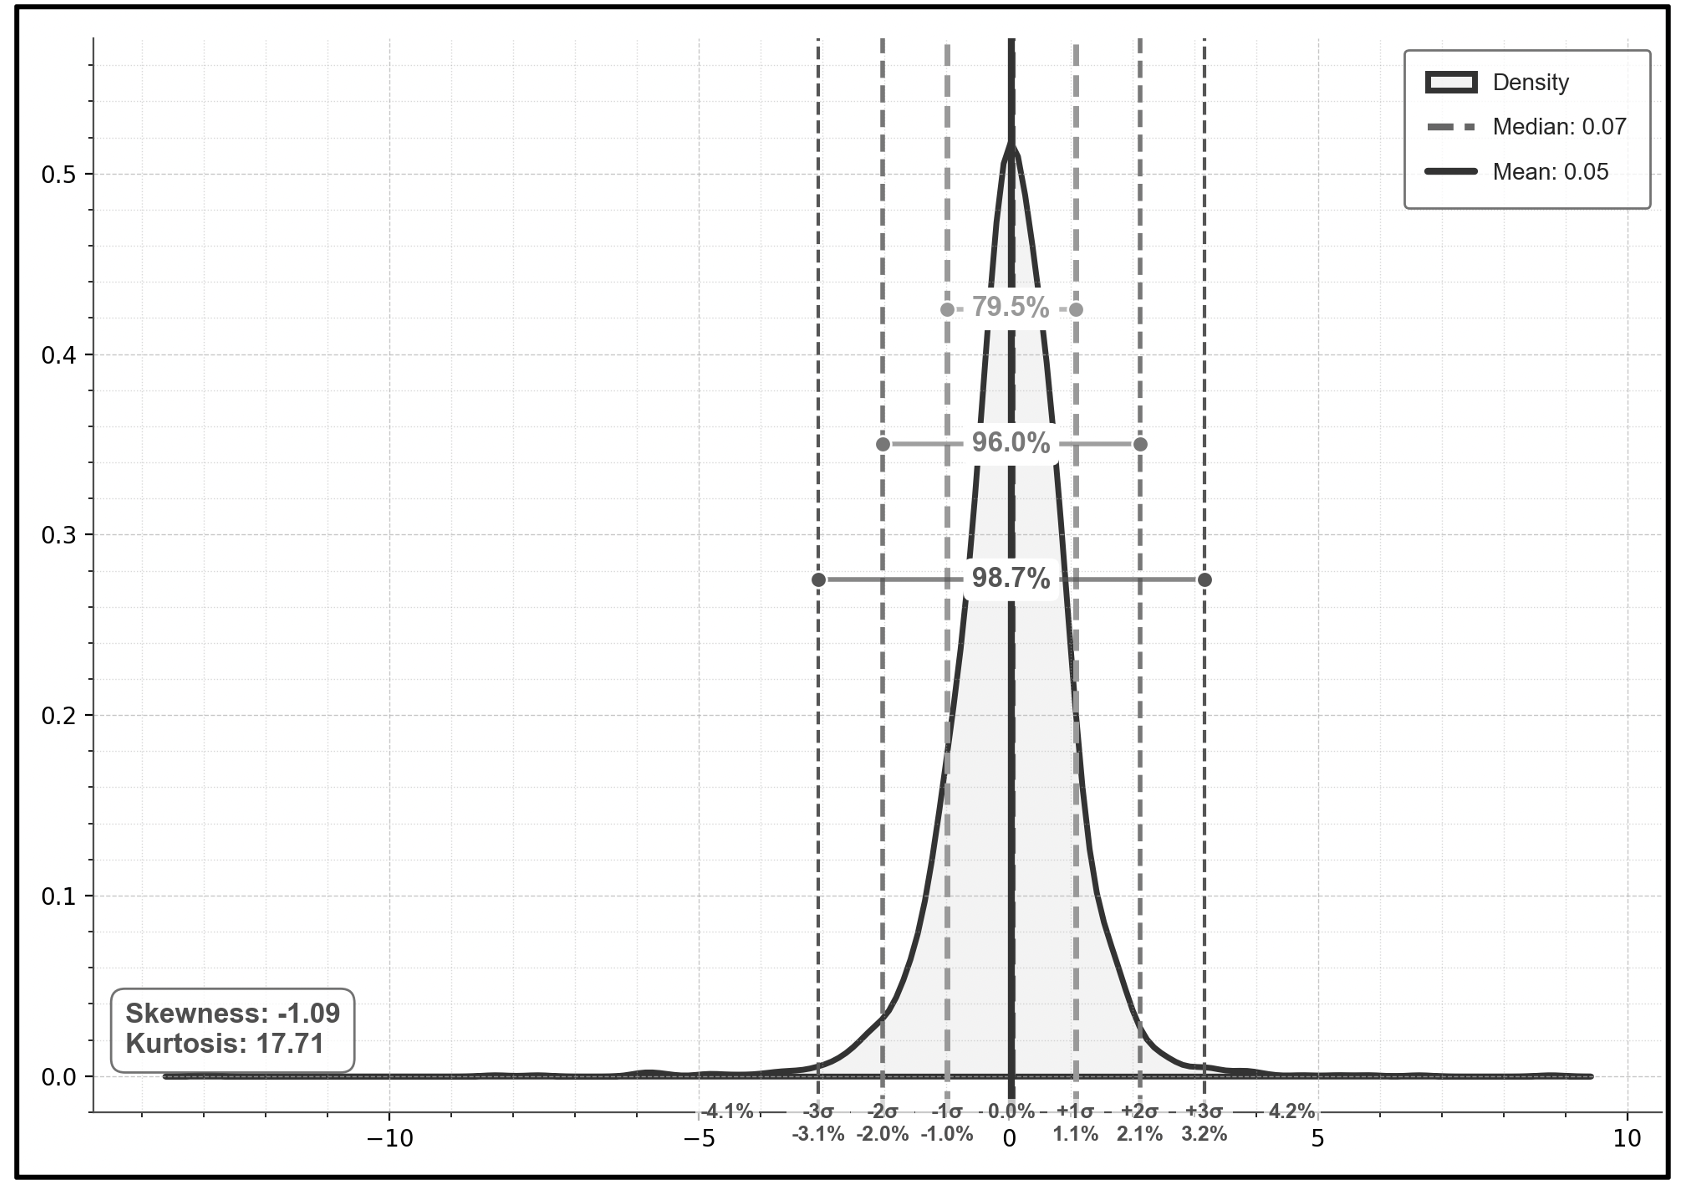
Density Plot Nifty 50 (10 Years, daily returns). Source: Quantwater Analysis
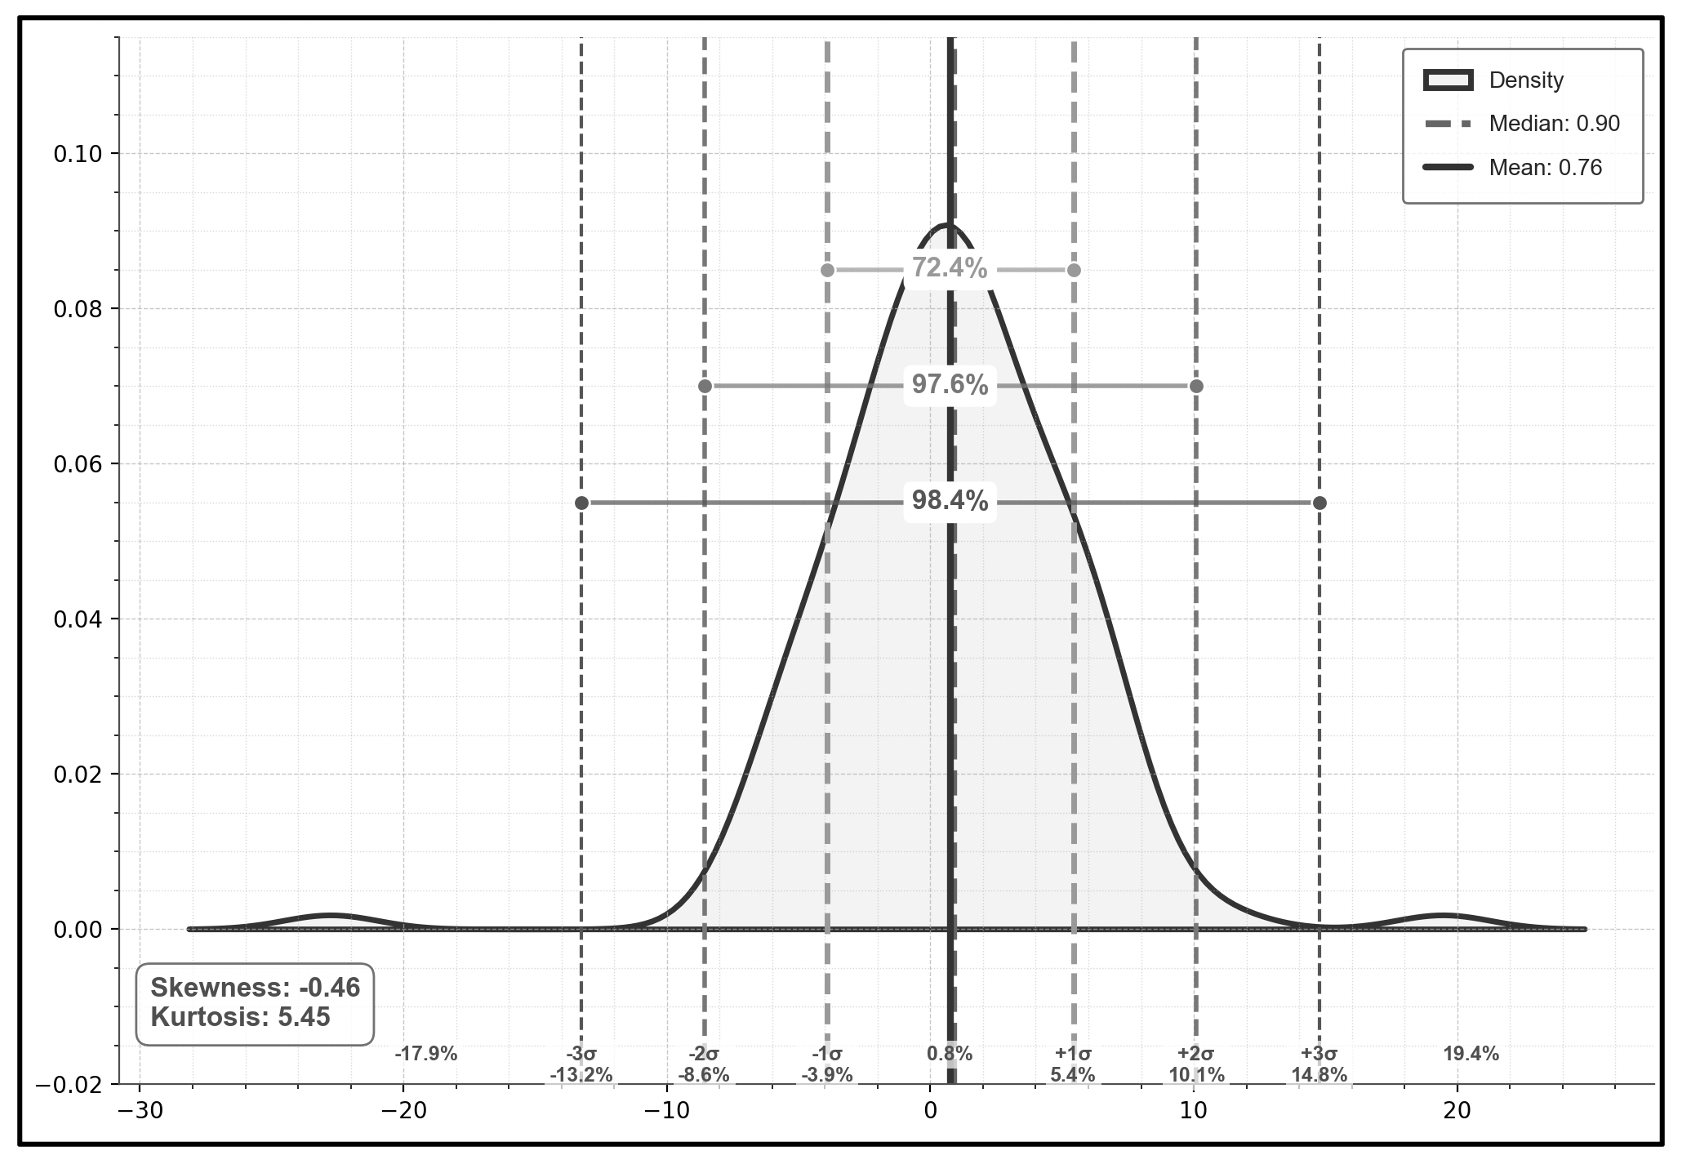
Density Plot Nifty 50 (10 Years, monthly returns). Source: Quantwater Analysis
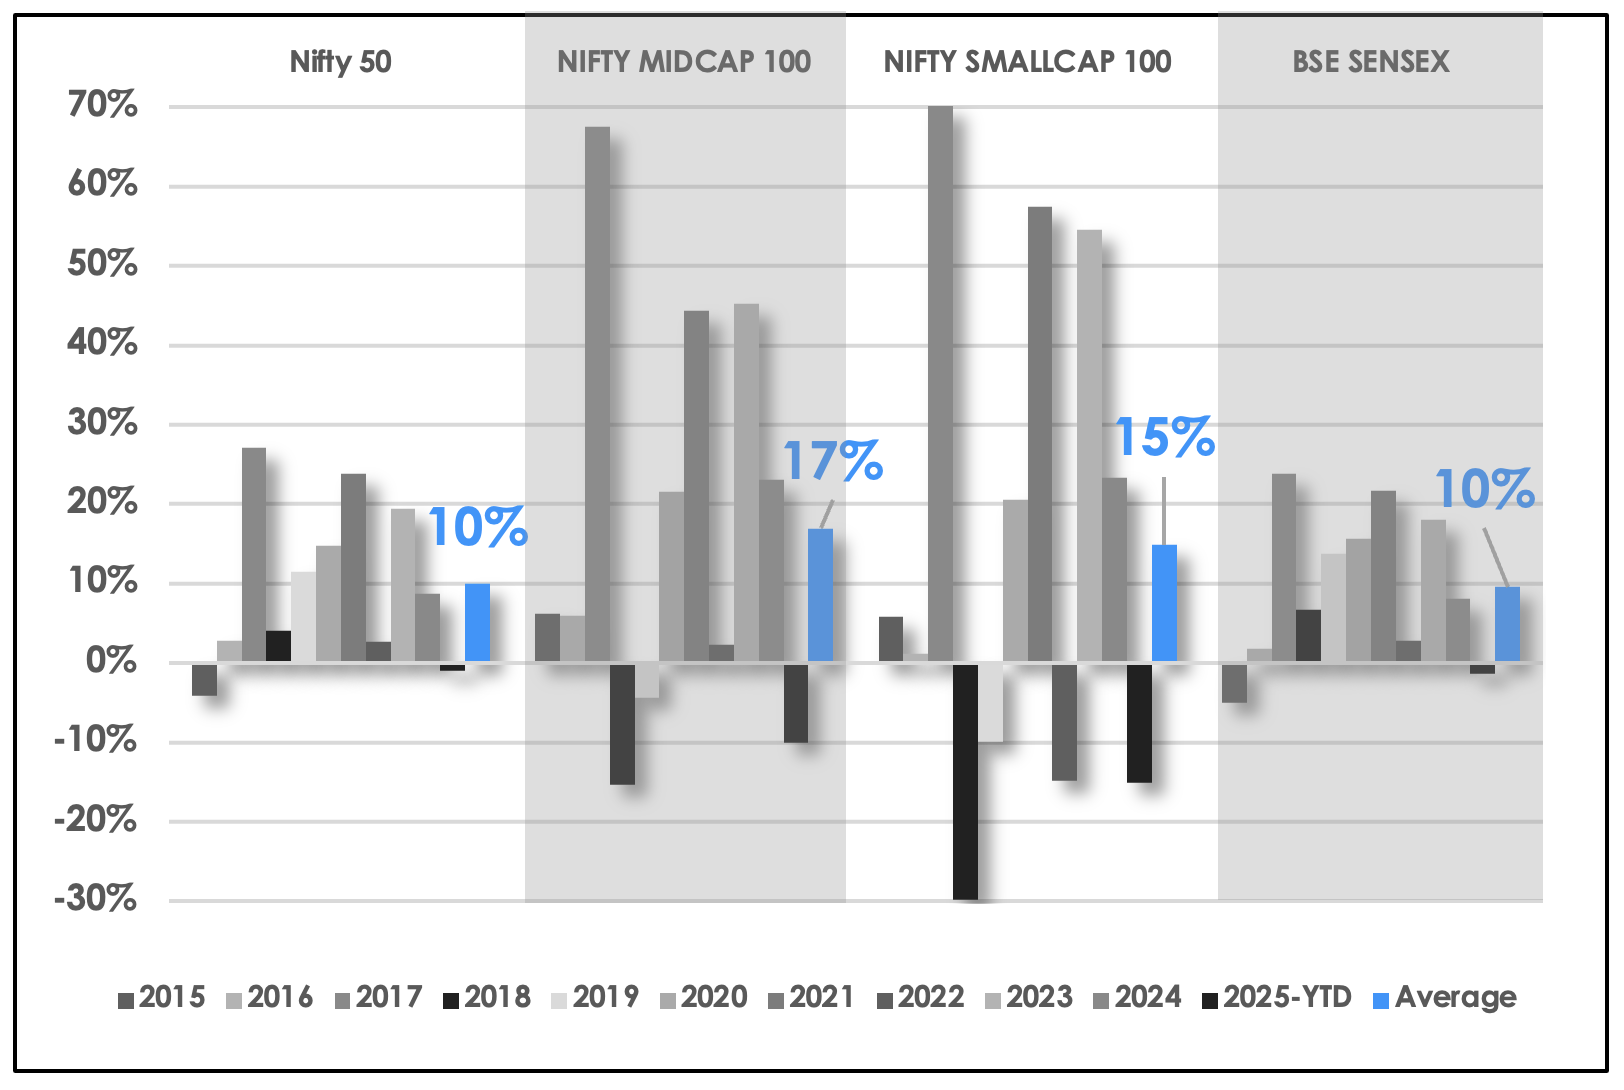
Historical Returns: 10 Years (INR). Source: Quantwater Analysis
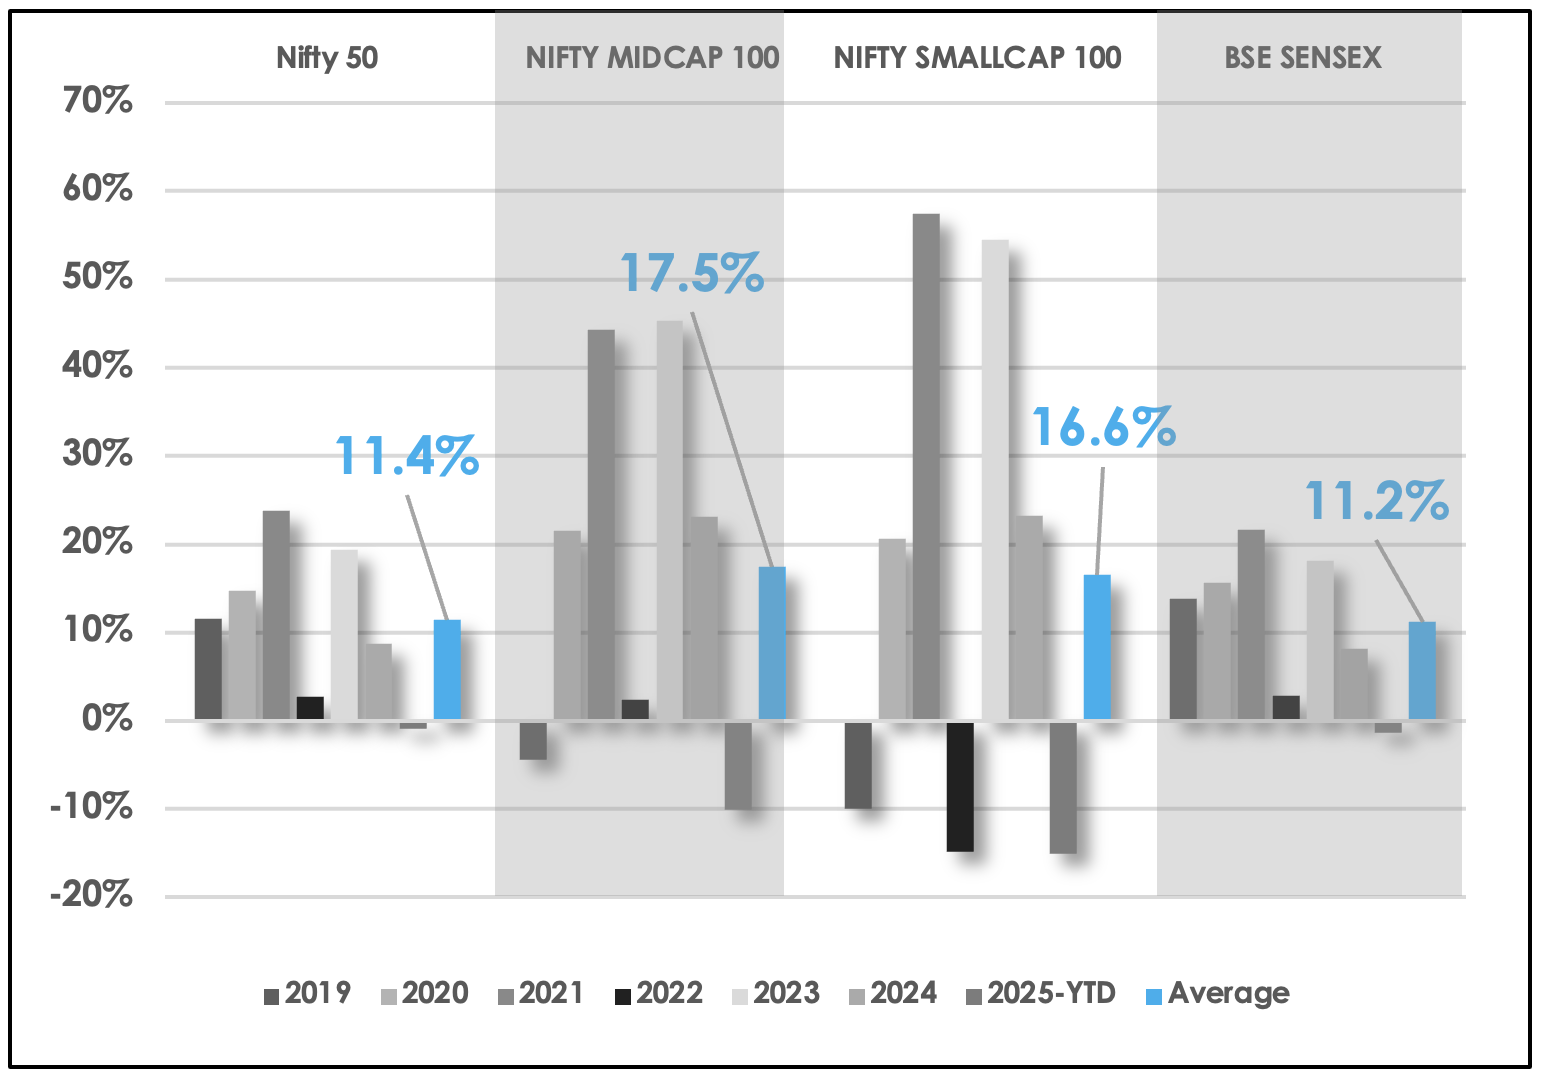
Historical Returns: 6 Years (INR). Source: Quantwater Analysis
Sector Performance - INR Terms
Sector performance is vibrant and varied, with IT, Banking, and Infrastructure showcasing distinct and promising trends.
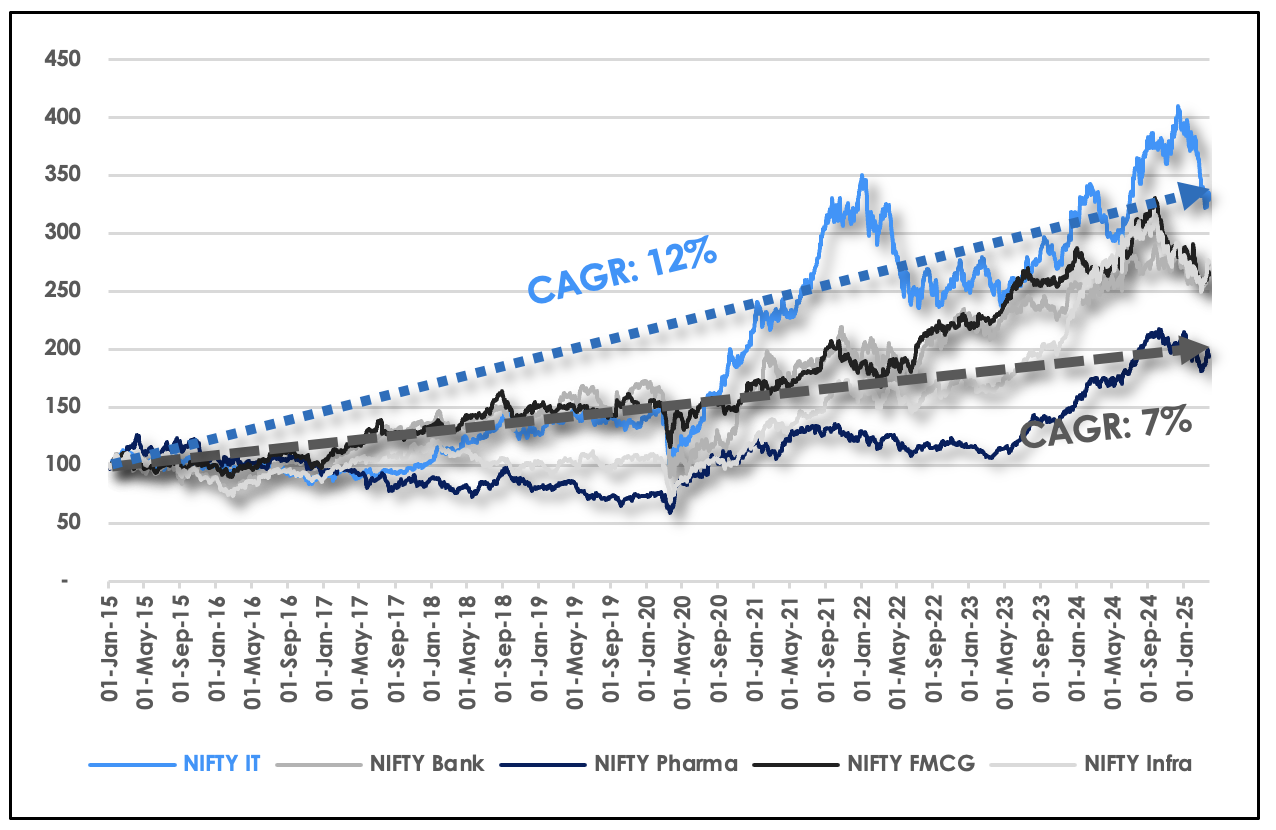
Sectoral Performance (10 Years) (1st Jan 2015 = 100, INR). Source: Quantwater Analysis
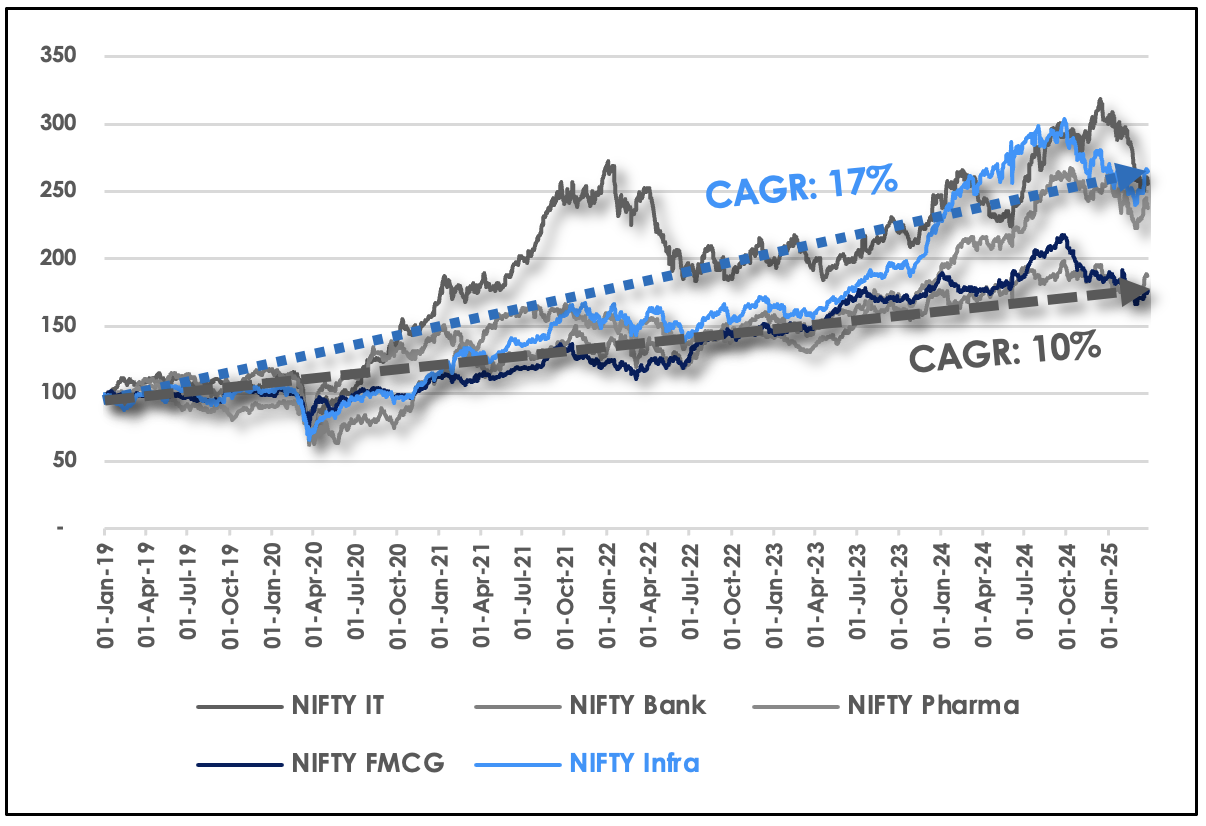
Sectoral Performance (6 Years) (1st Jan 2019 = 100, INR). Source: Quantwater Analysis
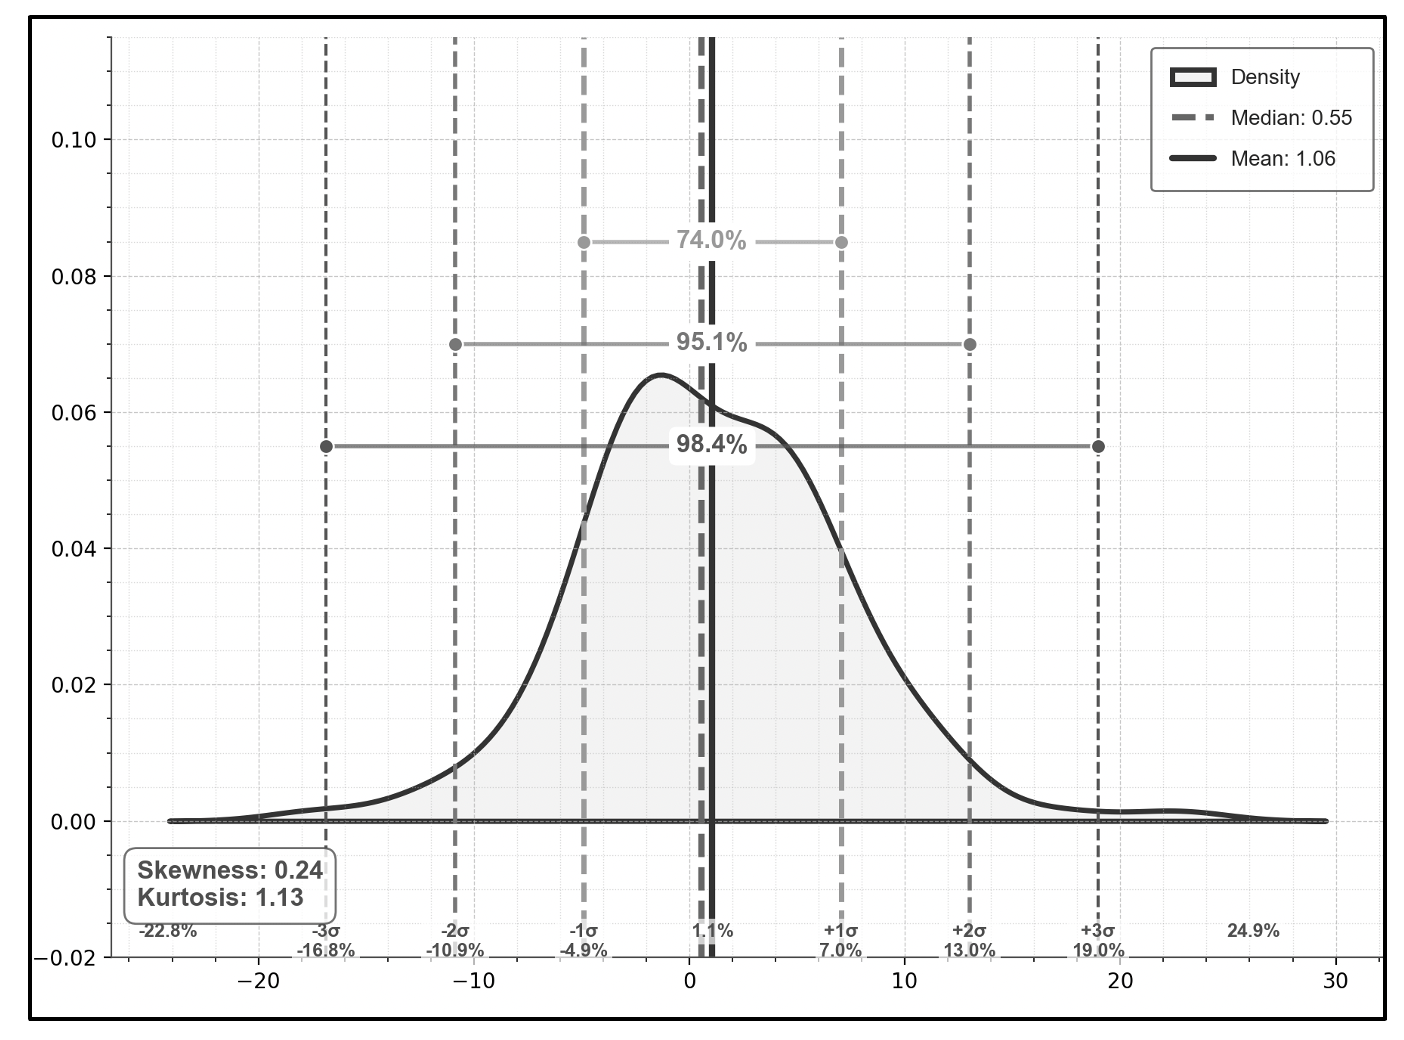
Density Plot Nifty IT (10 Years, monthly returns, INR). Source: Quantwater Analysis
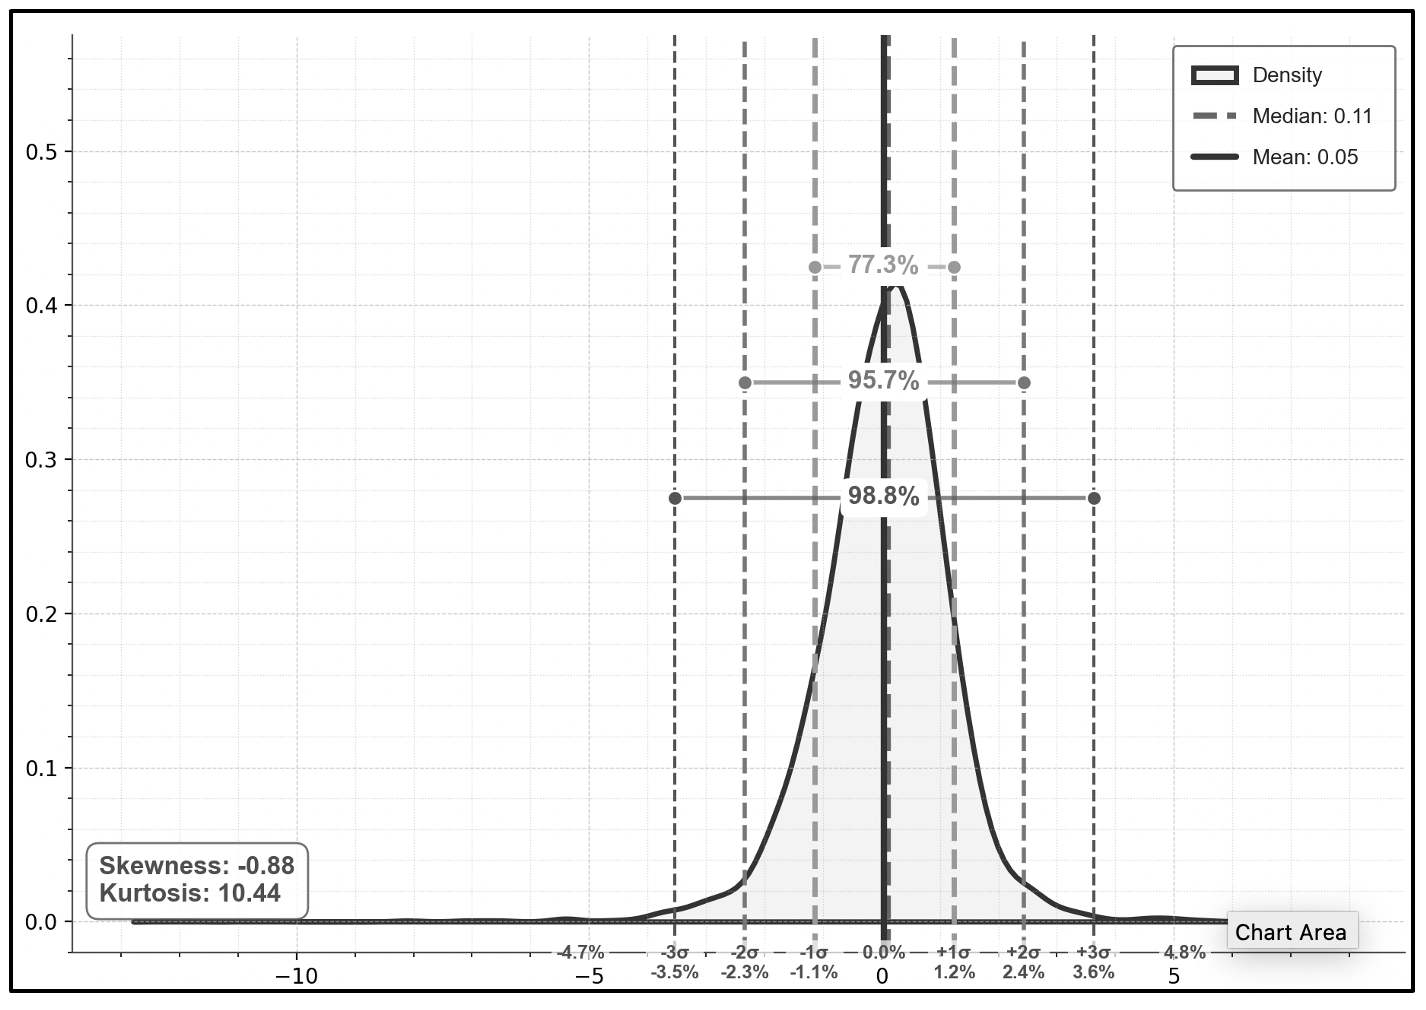
Density Plot Nifty Infra (10 Years, monthly returns, INR). Source: Quantwater Analysis
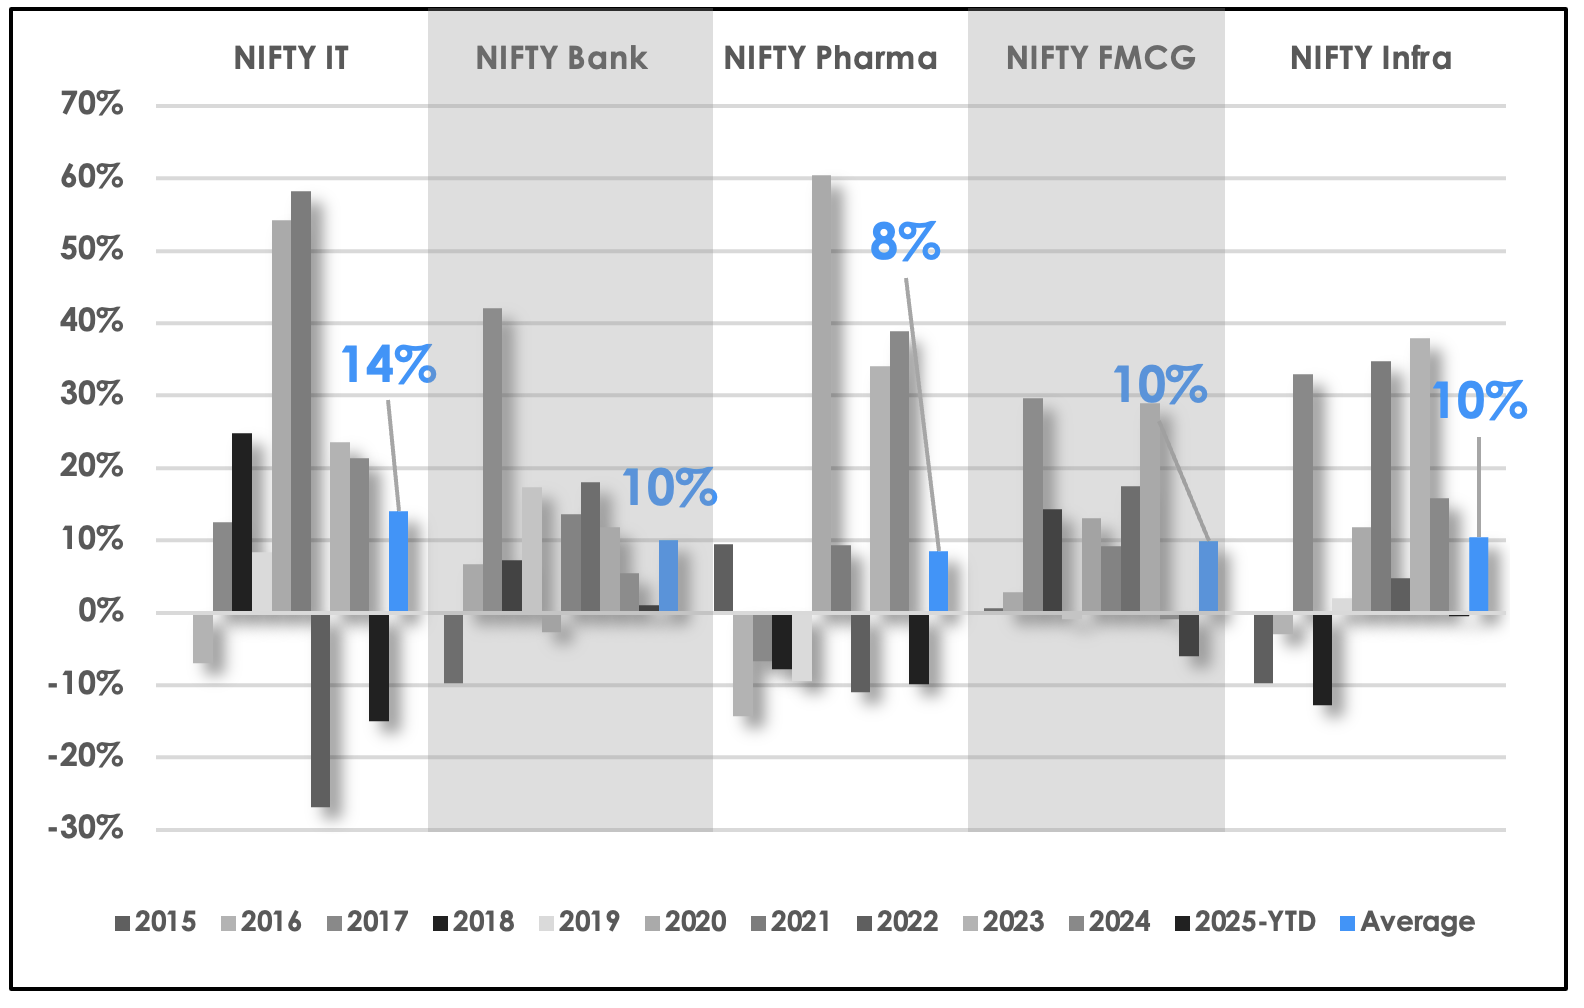
Sector Historical Returns – 10 Years (INR). Source: Quantwater Analysis
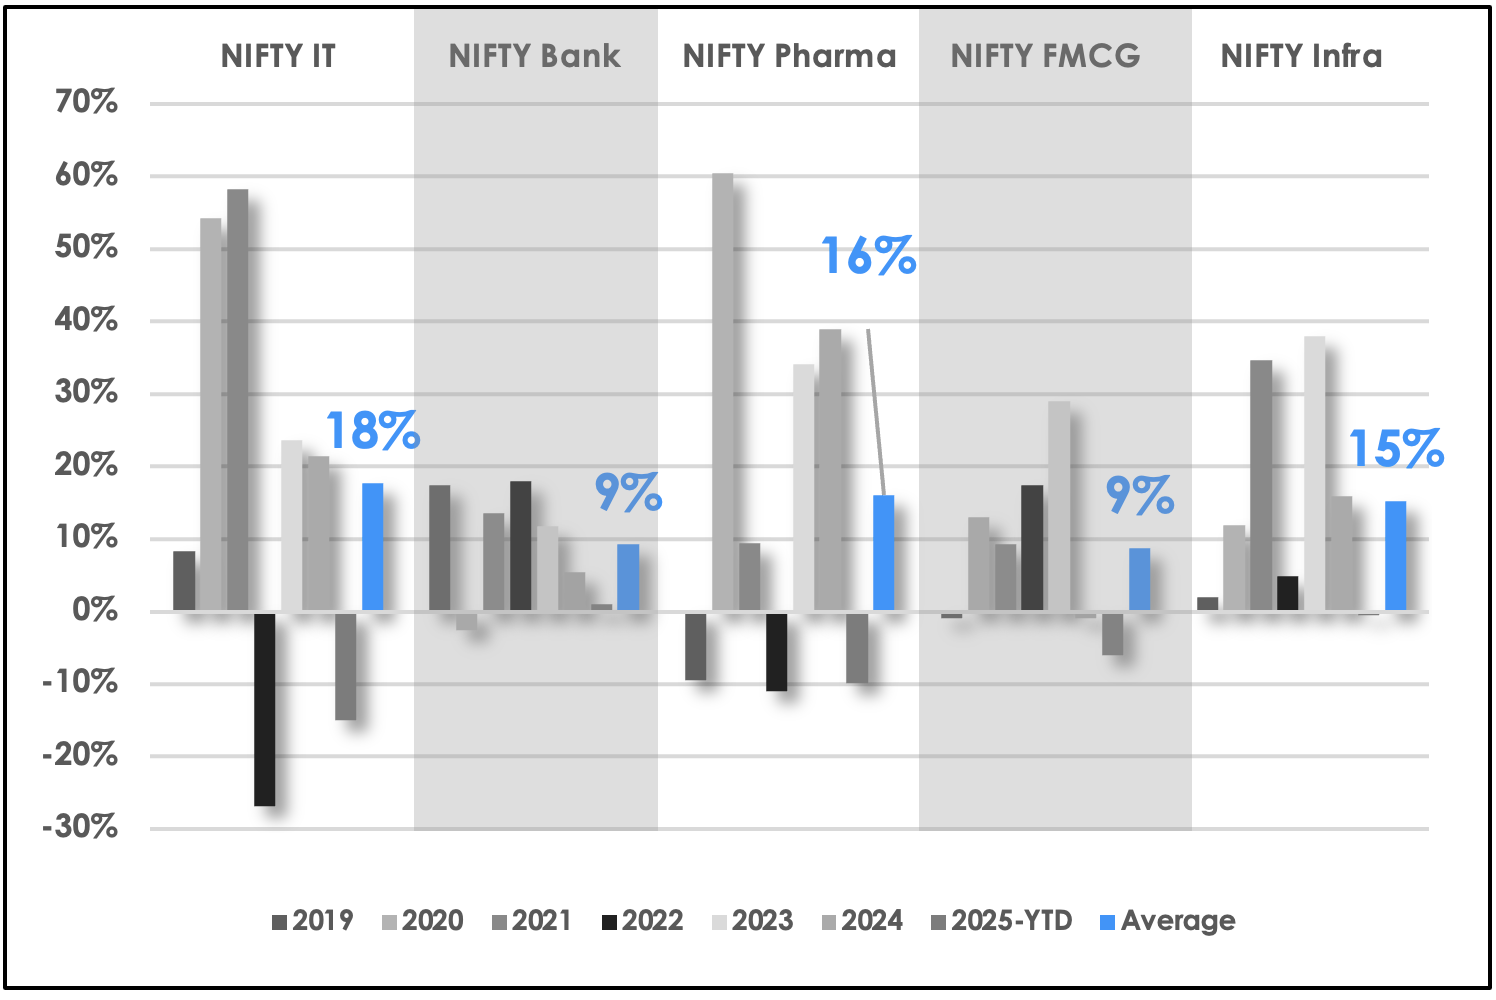
Sector Historical Returns – 6 Years (INR). Source: Quantwater Analysis
Volatility - INR Terms
Volatility, a natural companion to high-growth markets, is primarily influenced by global currents, fund flows, and policy shifts. A clear understanding of these dynamic patterns and historical return characteristics is key to strategic asset allocation, allowing investors to harness the market's energy.
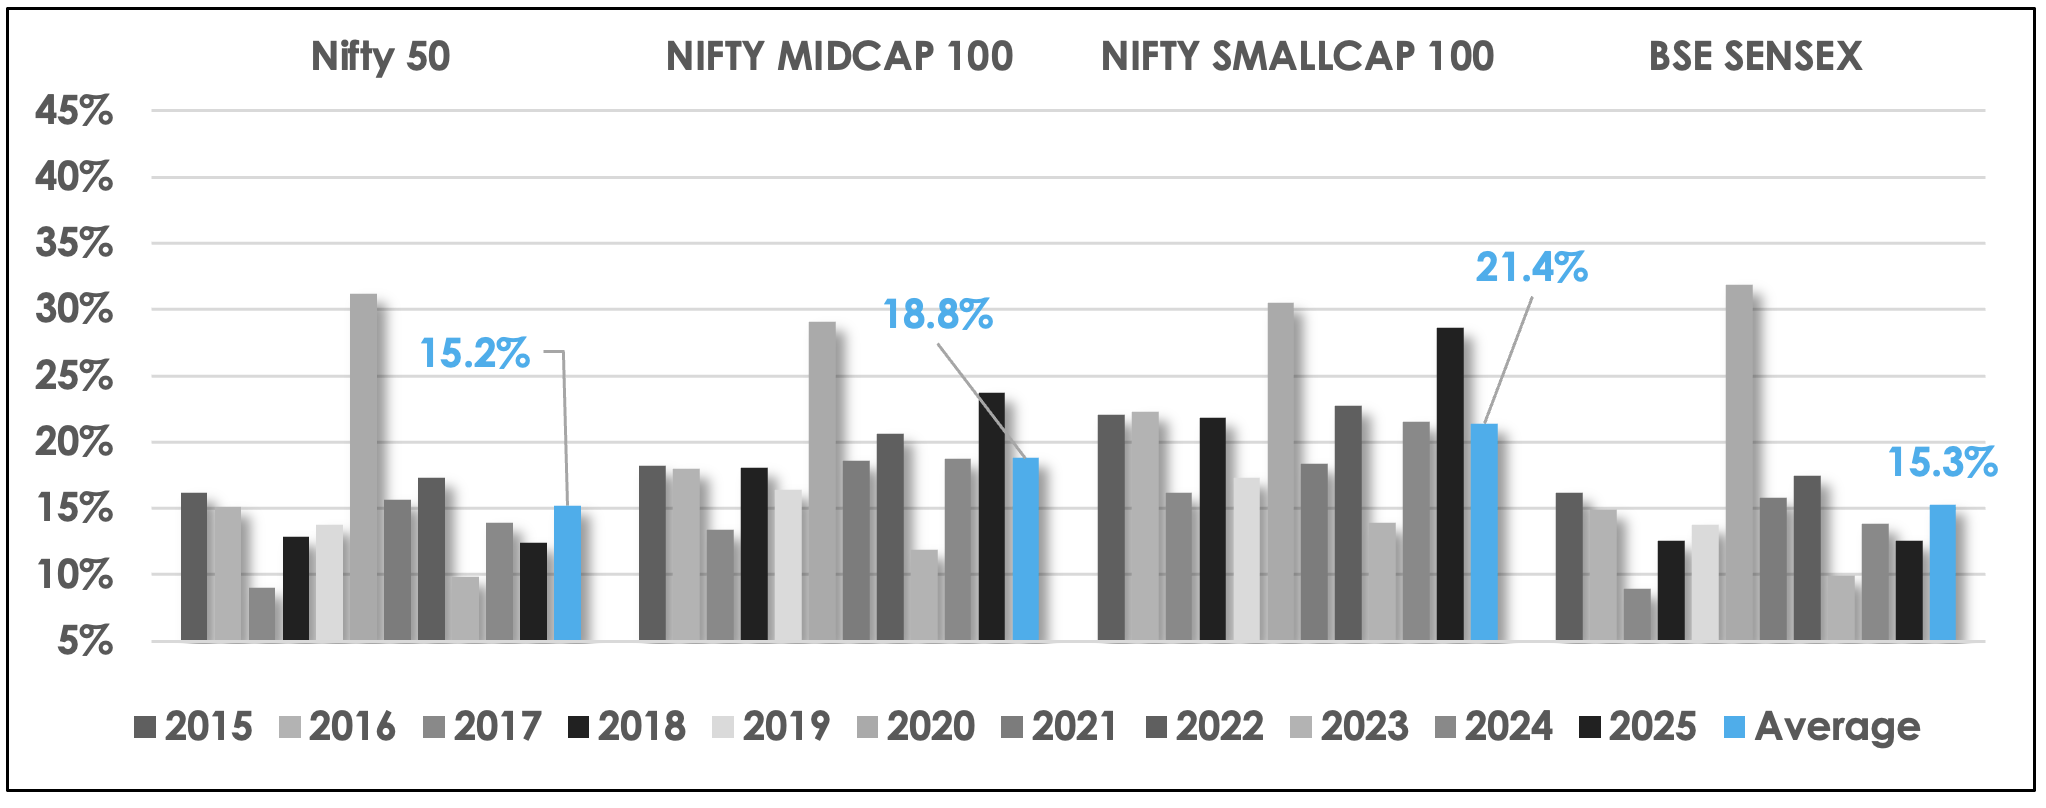
Annualized Volatility - Indices (INR). Source: Quantwater Analysis
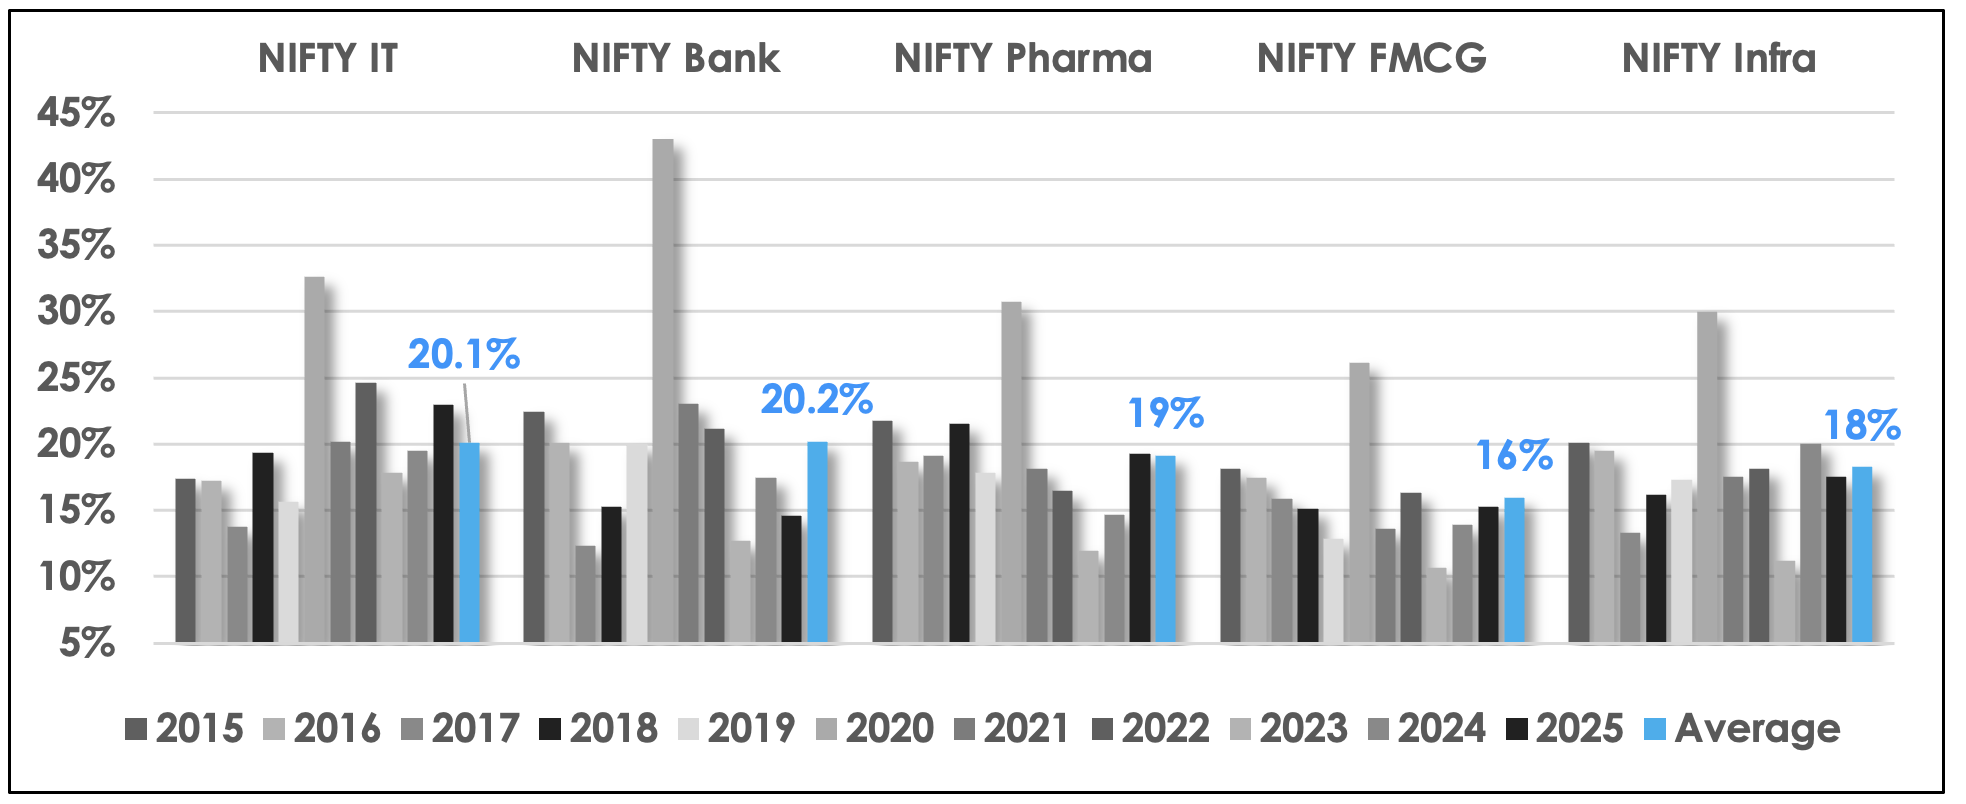
Annualized Volatility - Sectors (INR). Source: Quantwater Analysis
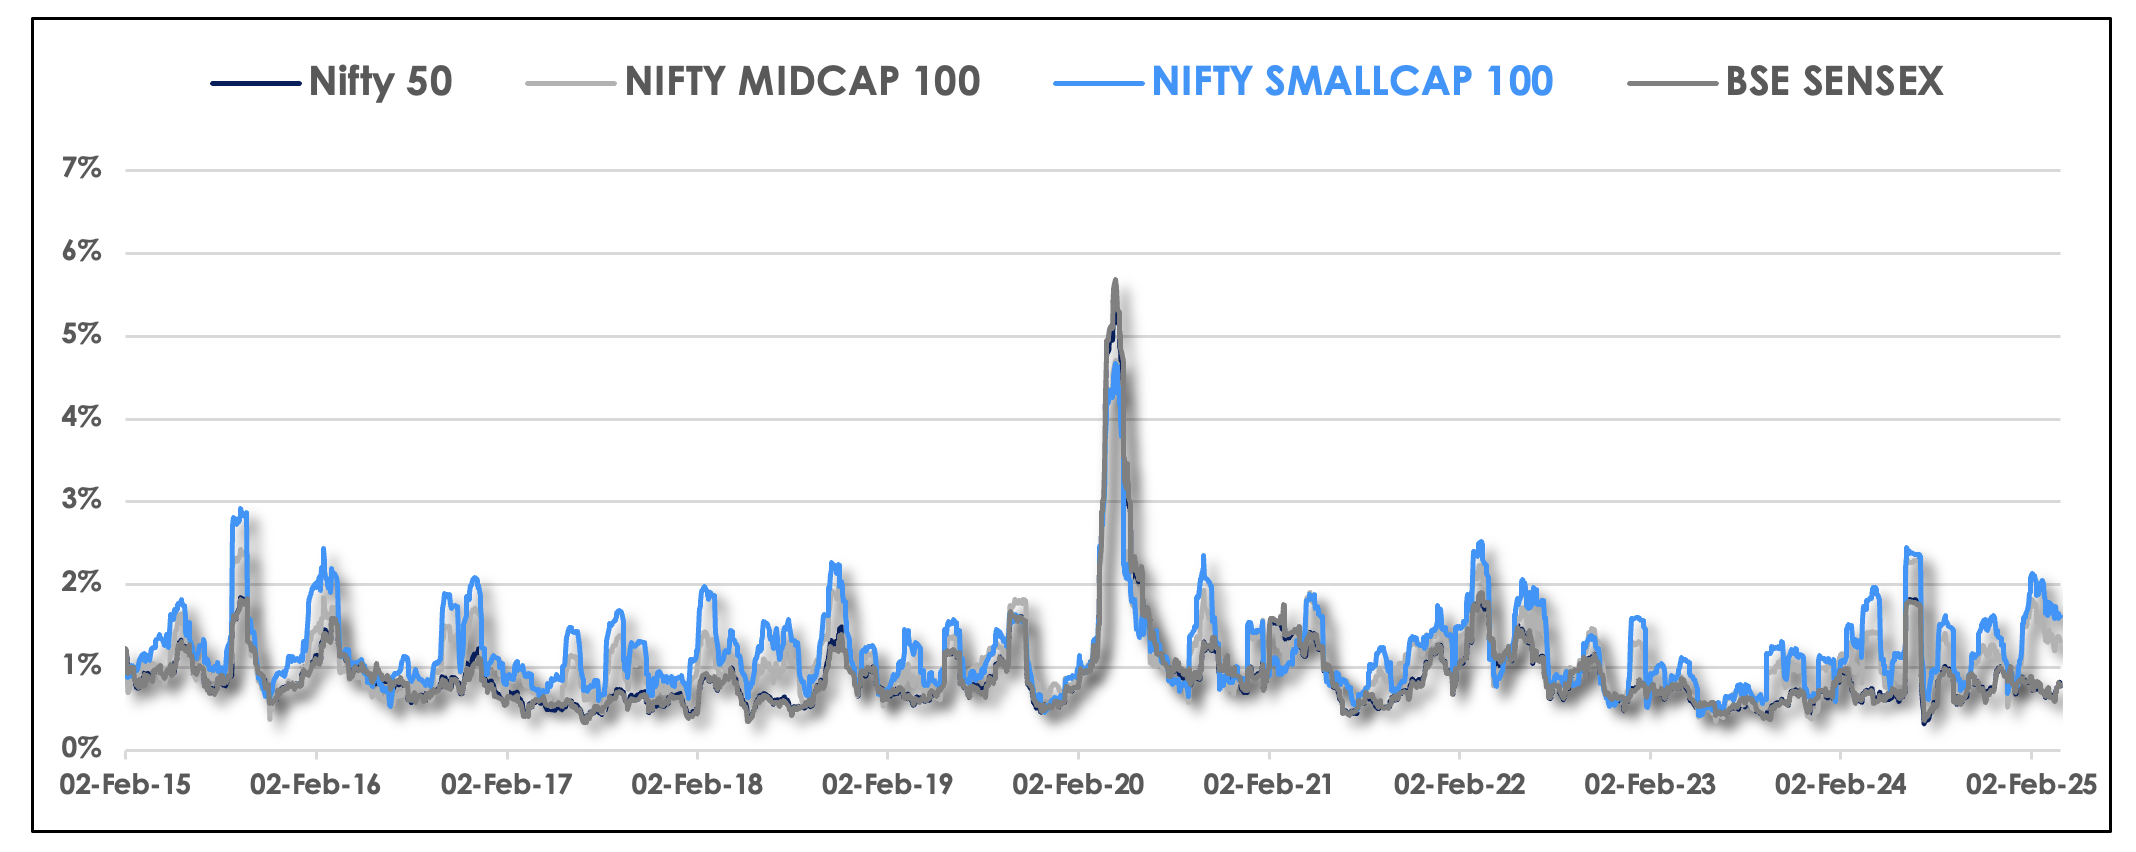
Rolling Volatility (1 month) - Indices (INR). Source: Quantwater Analysis
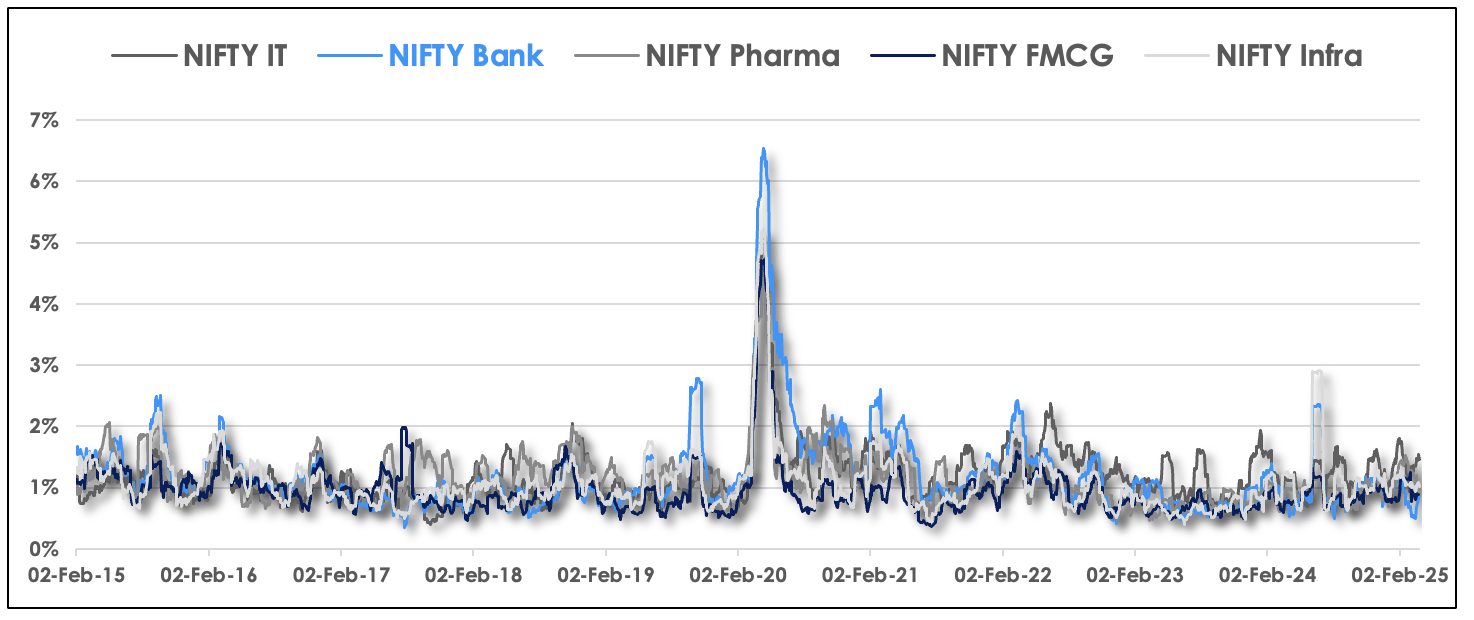
Rolling Volatility (1 month) - Sectors (INR). Source: Quantwater Analysis
Capital Markets: Performance & Volatility - USD Terms
For international investors, India's equity markets present a compelling picture even when viewed in USD terms, showcasing the fundamental strength of the growth story beyond currency fluctuations.
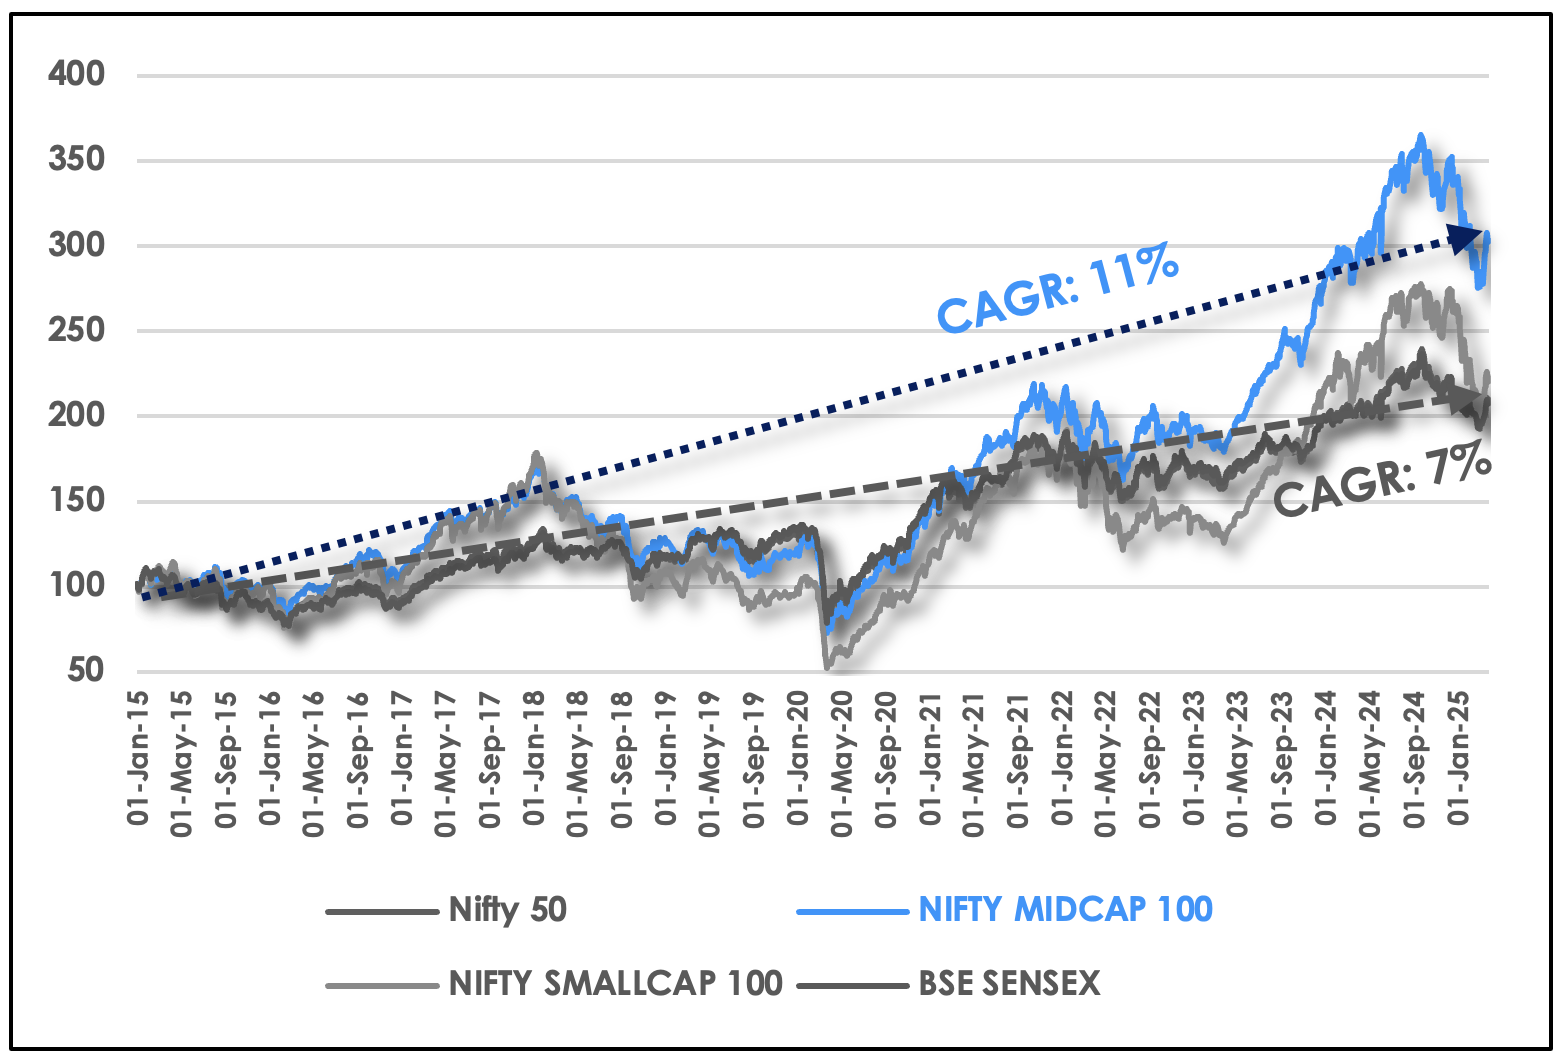
Capital Market Performance USD - Indices (10 Year). Source: Quantwater Analysis
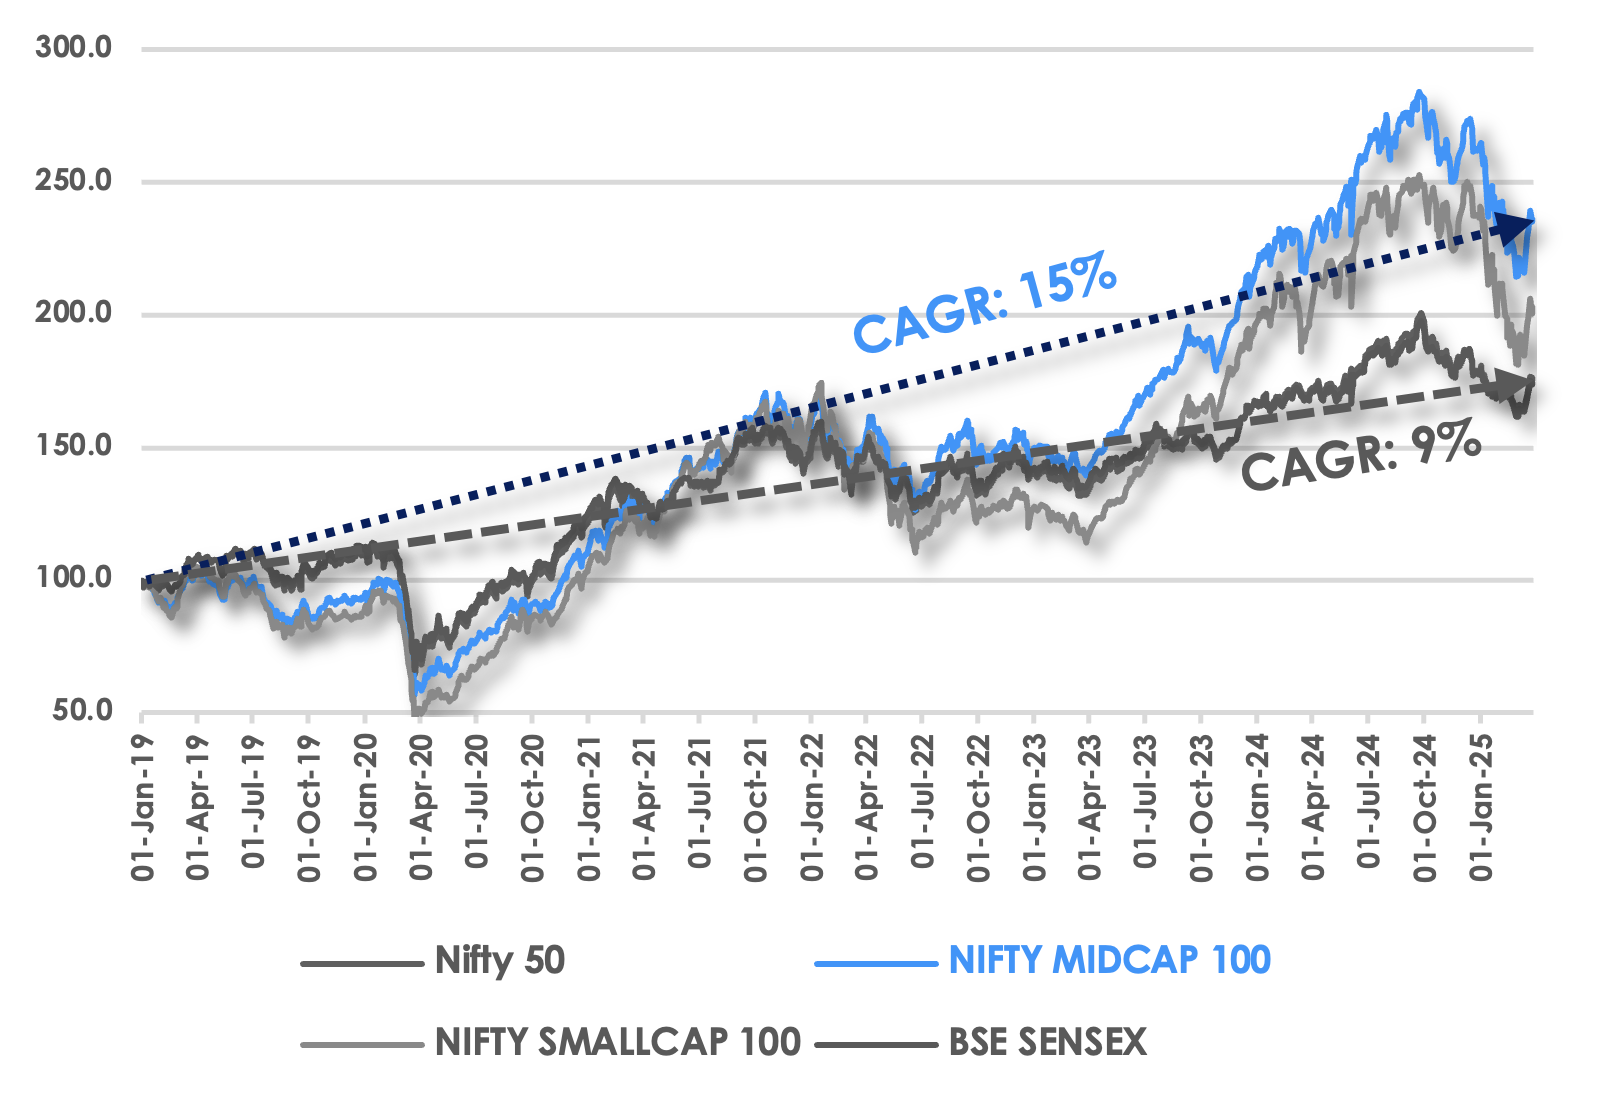
Capital Market Performance USD - Indices (6 Year). Source: Quantwater Analysis
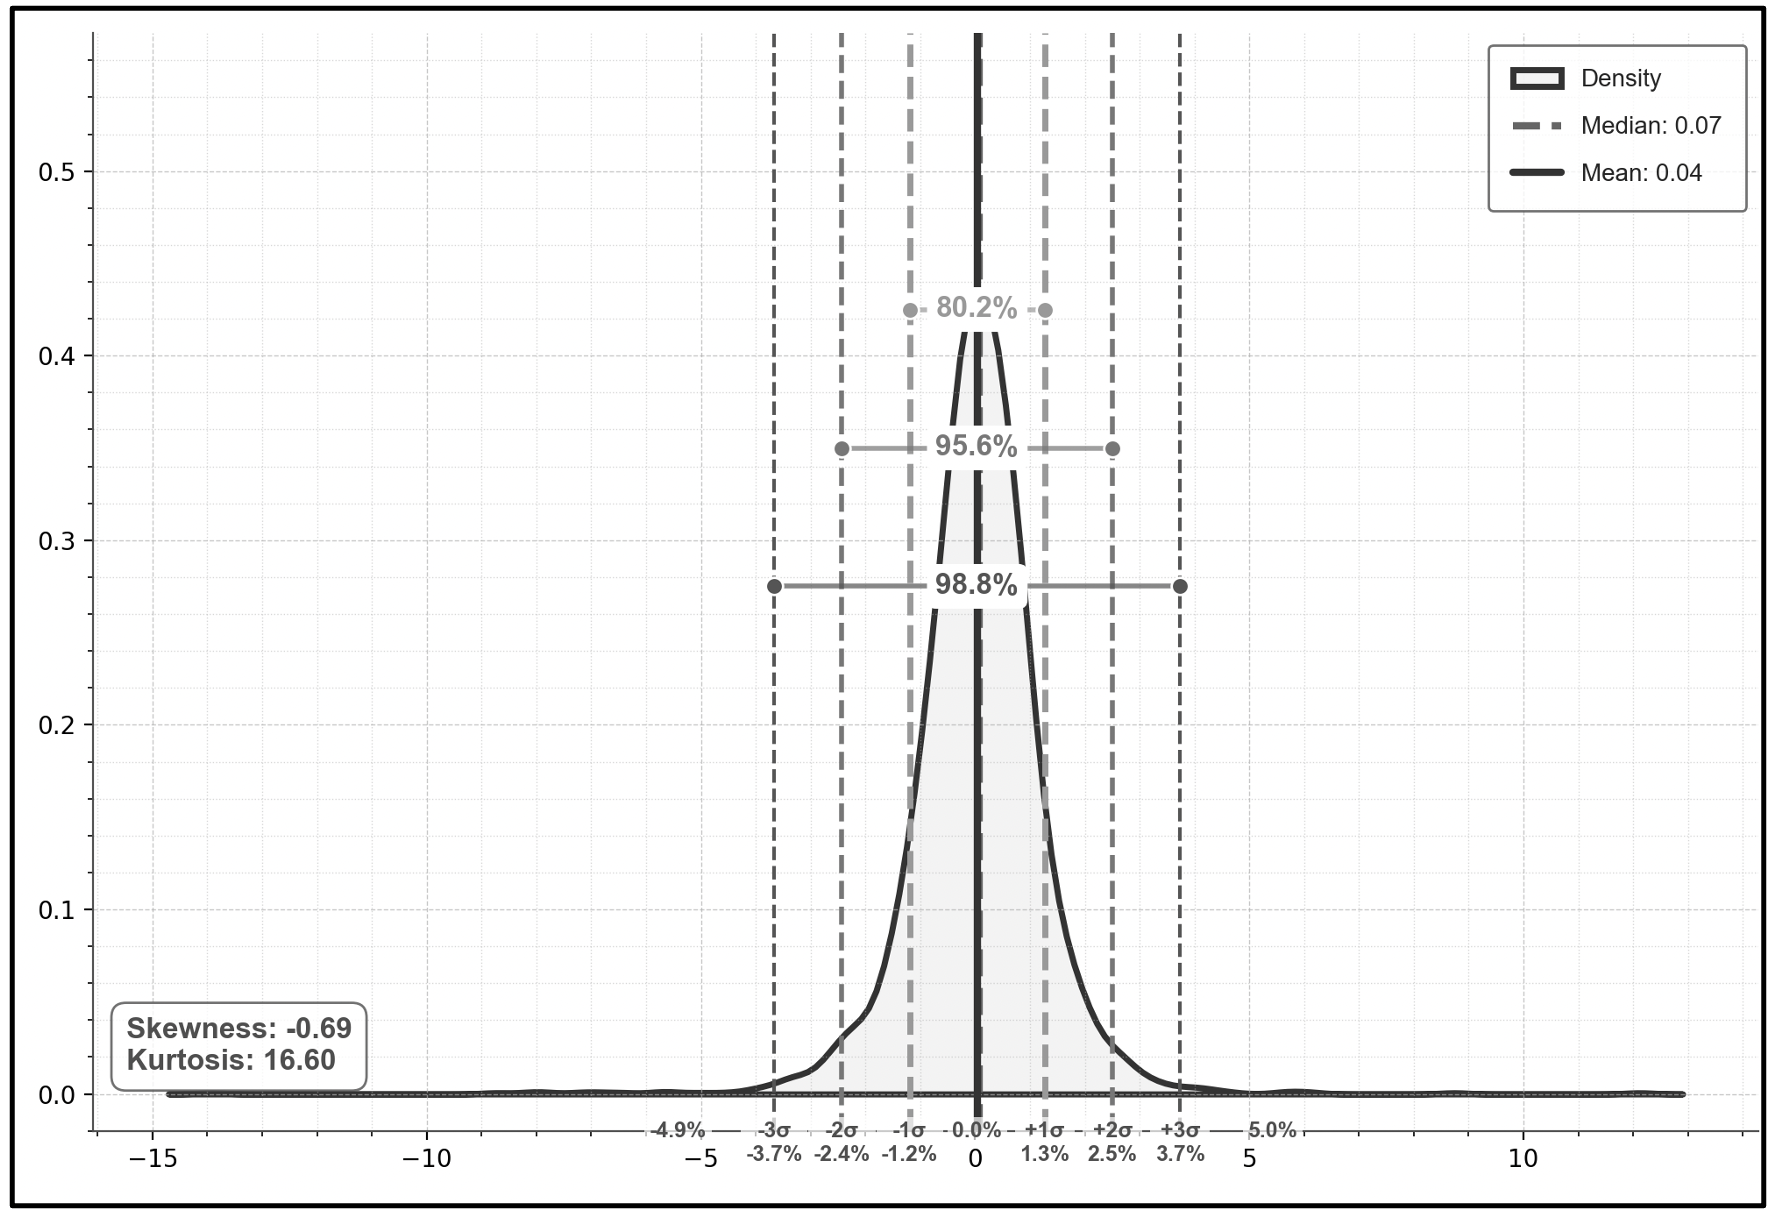
Density Plot Nifty 50 (10 Years, daily returns, USD). Source: Quantwater Analysis
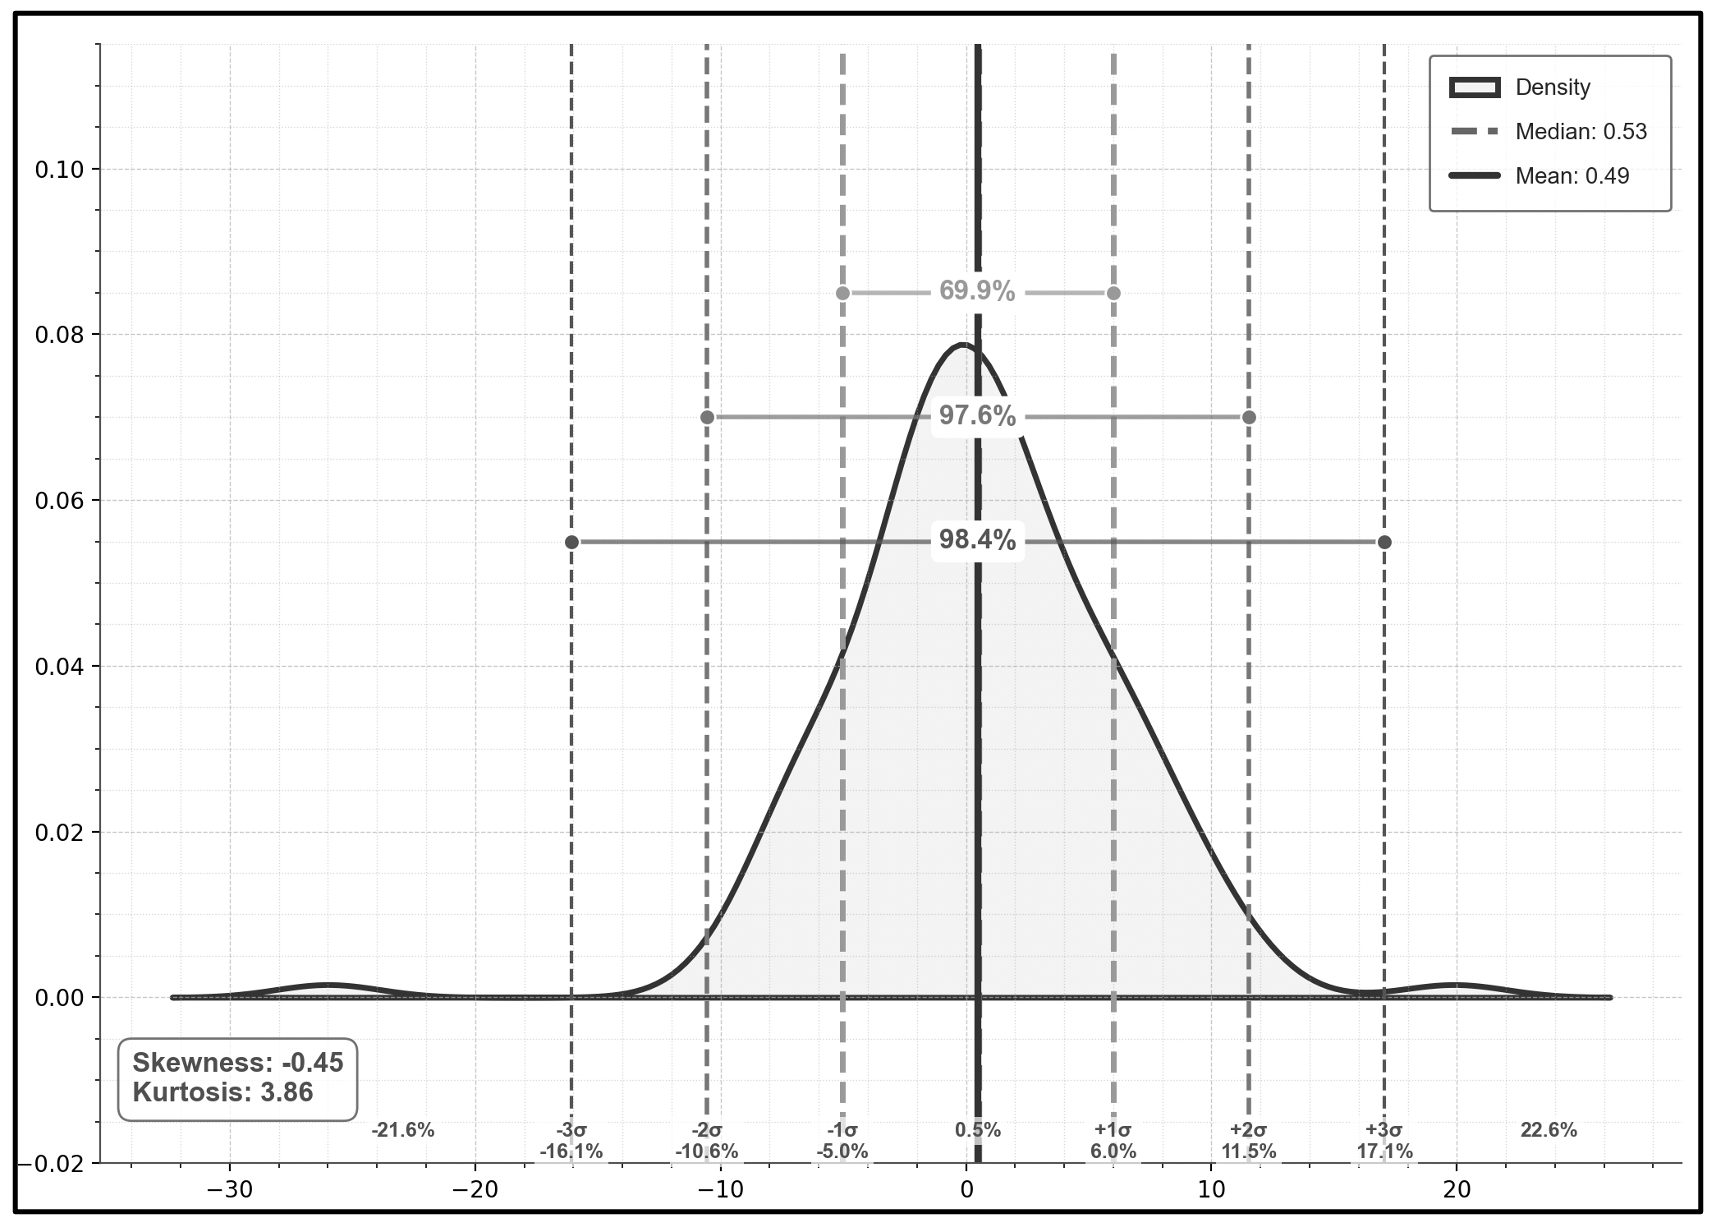
Density Plot Nifty 50 (10 Years, monthly returns, USD). Source: Quantwater Analysis
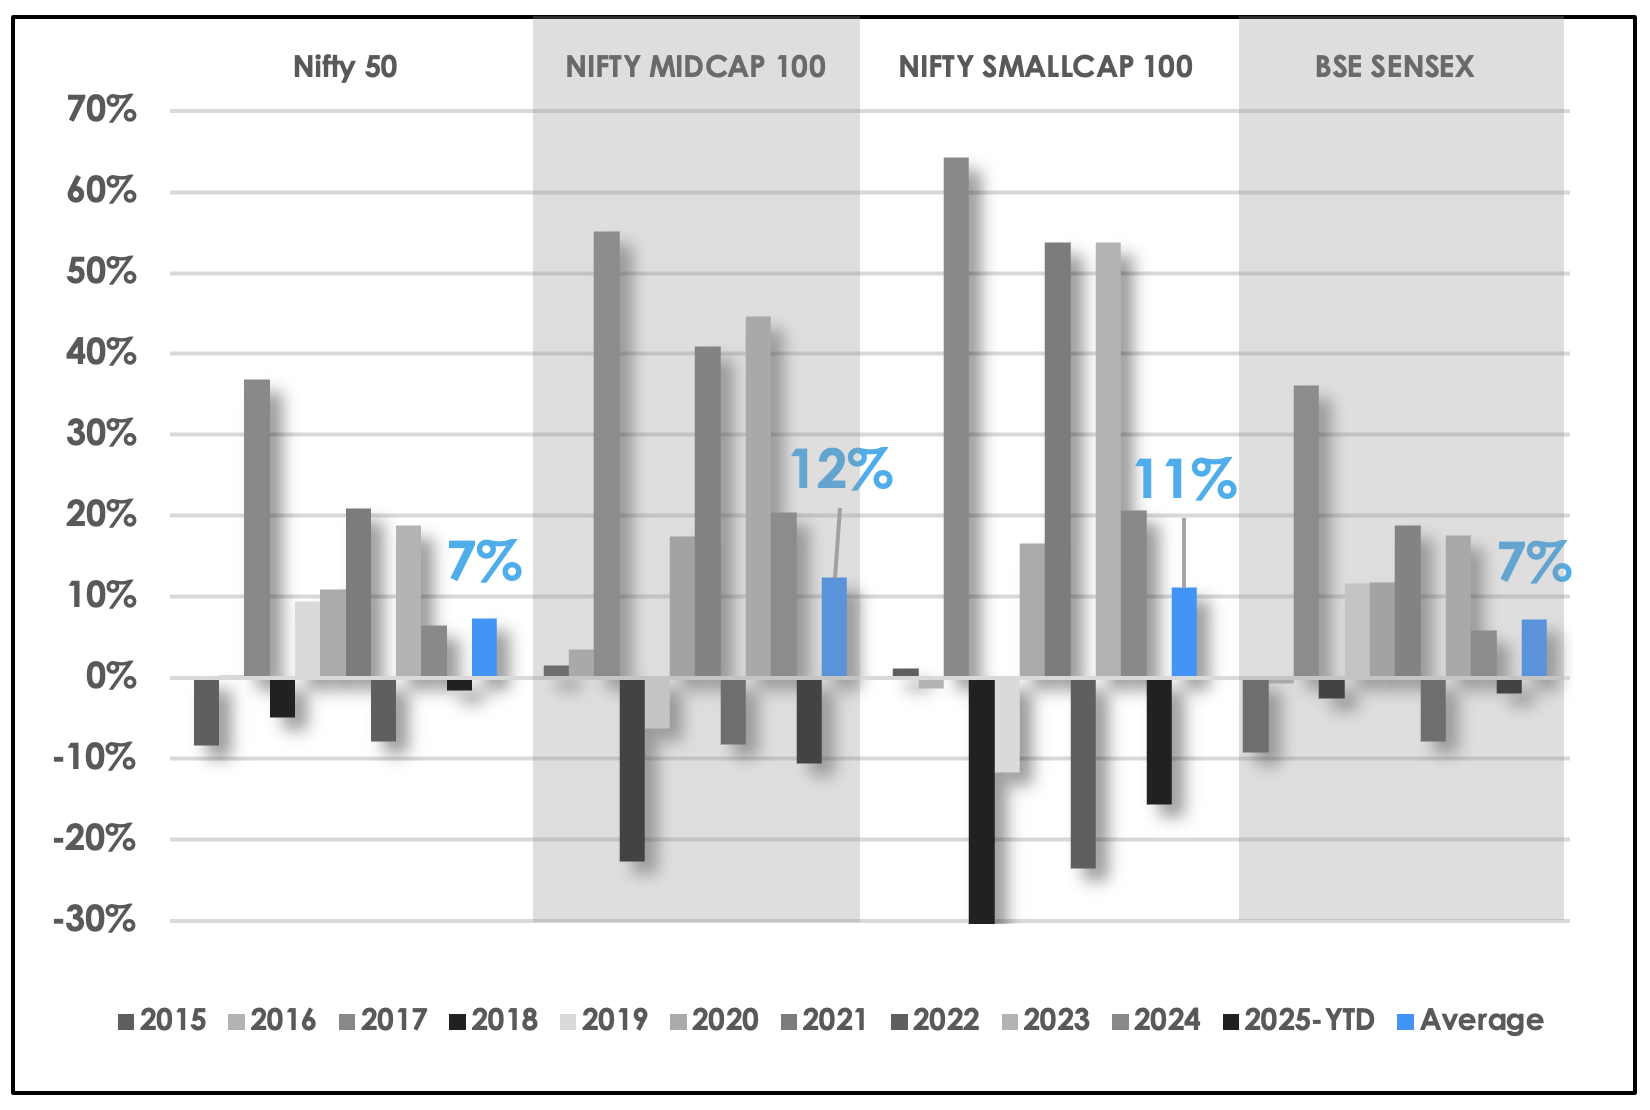
Historical Returns – 10 Years (USD). Source: Quantwater Analysis
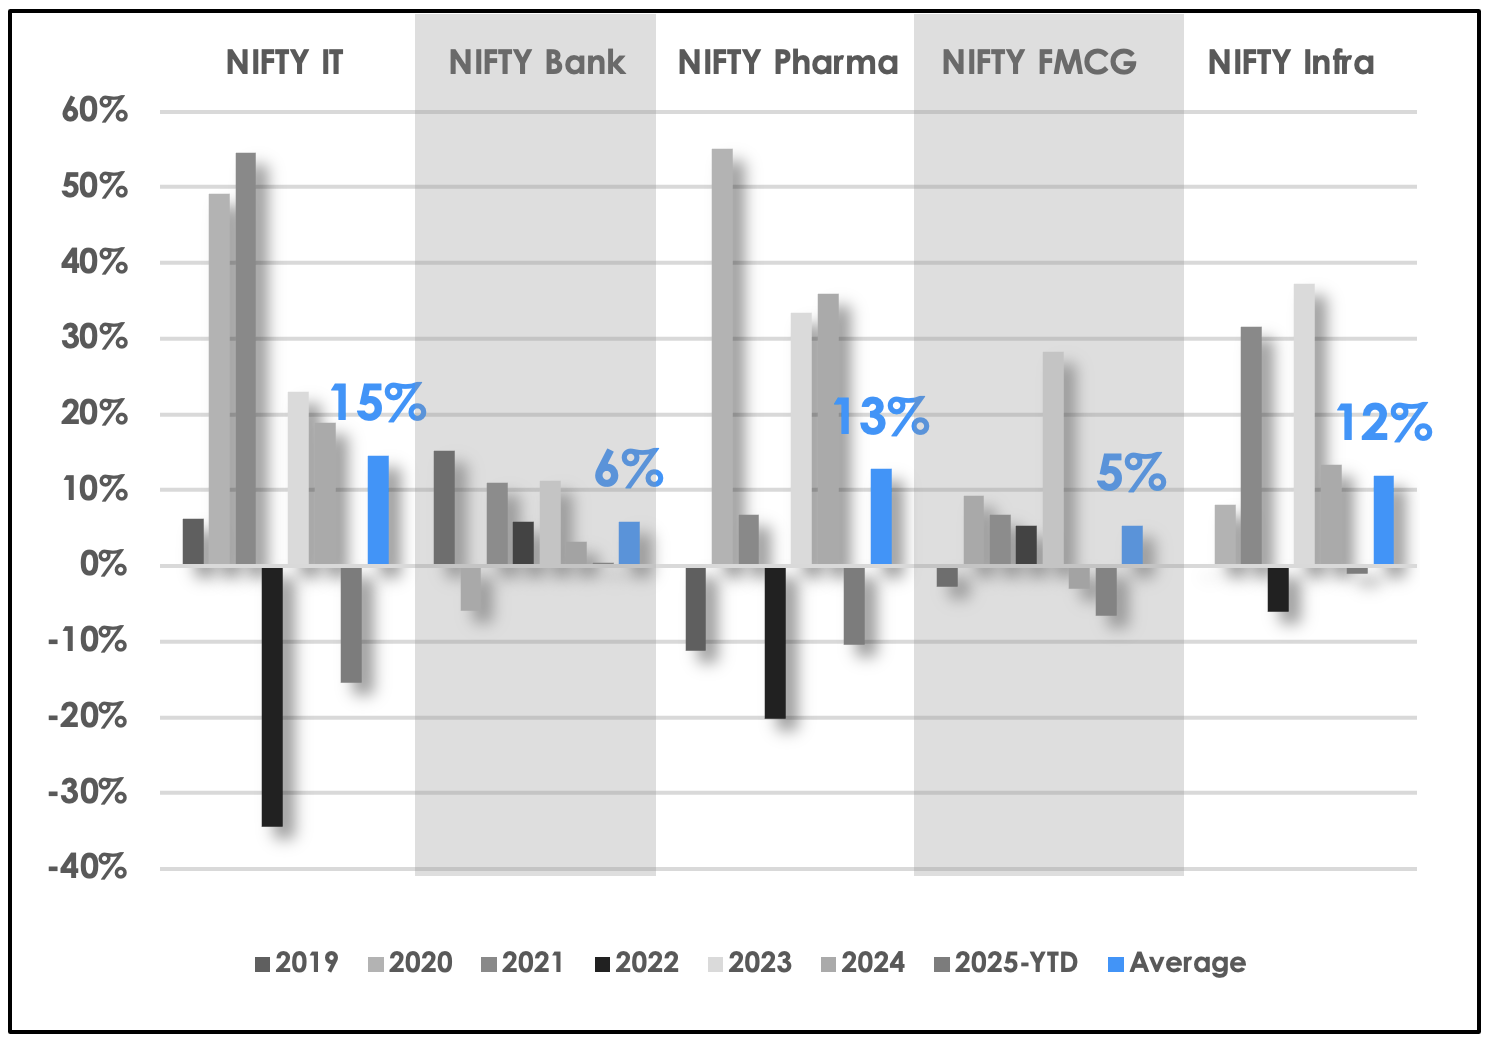
Historical Returns – 6 Years (USD). Source: Quantwater Analysis
Sector Performance - USD Terms
Sectoral performance in USD terms further underscores the diverse opportunities available, highlighting robust growth across various segments for global investors.
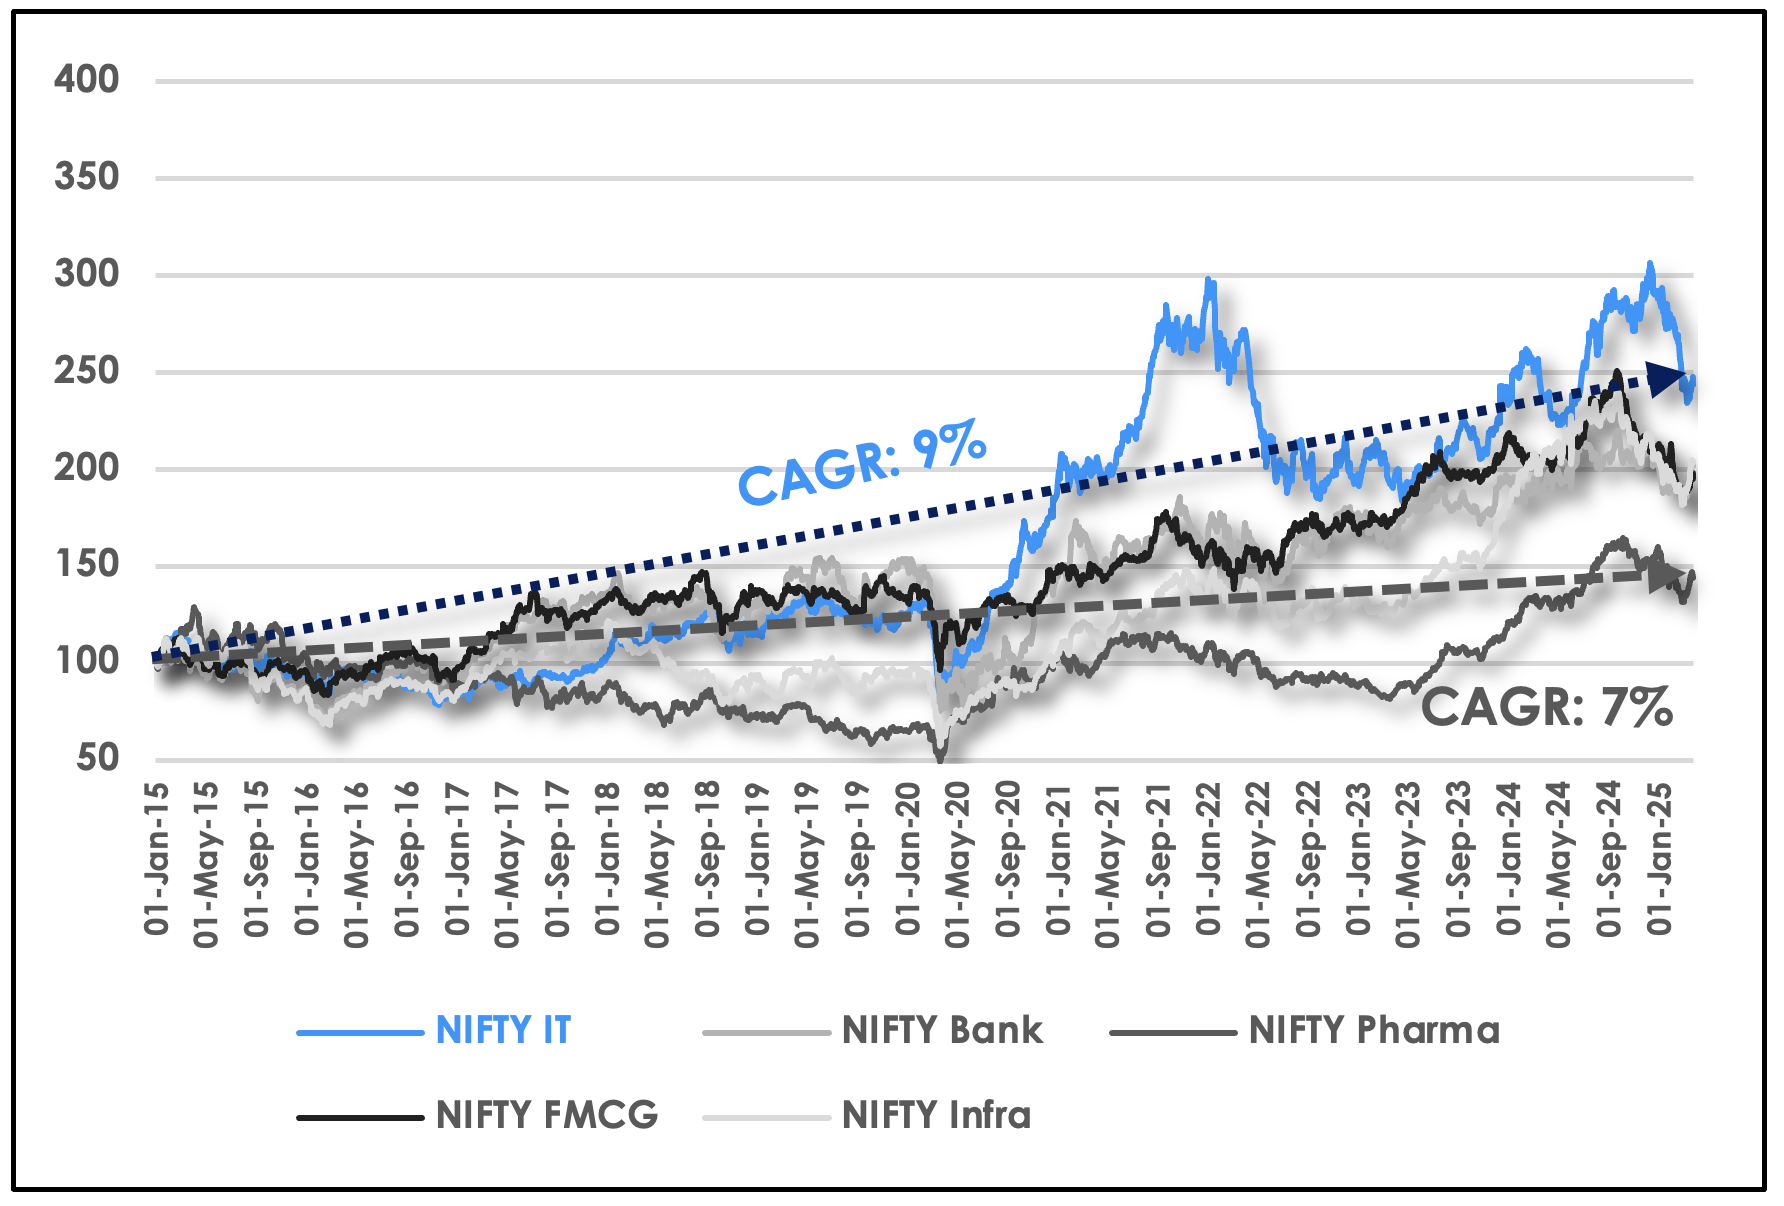
Sectoral Performance (10 Years) (1st Jan 2015 = 100, USD). Source: Quantwater Analysis
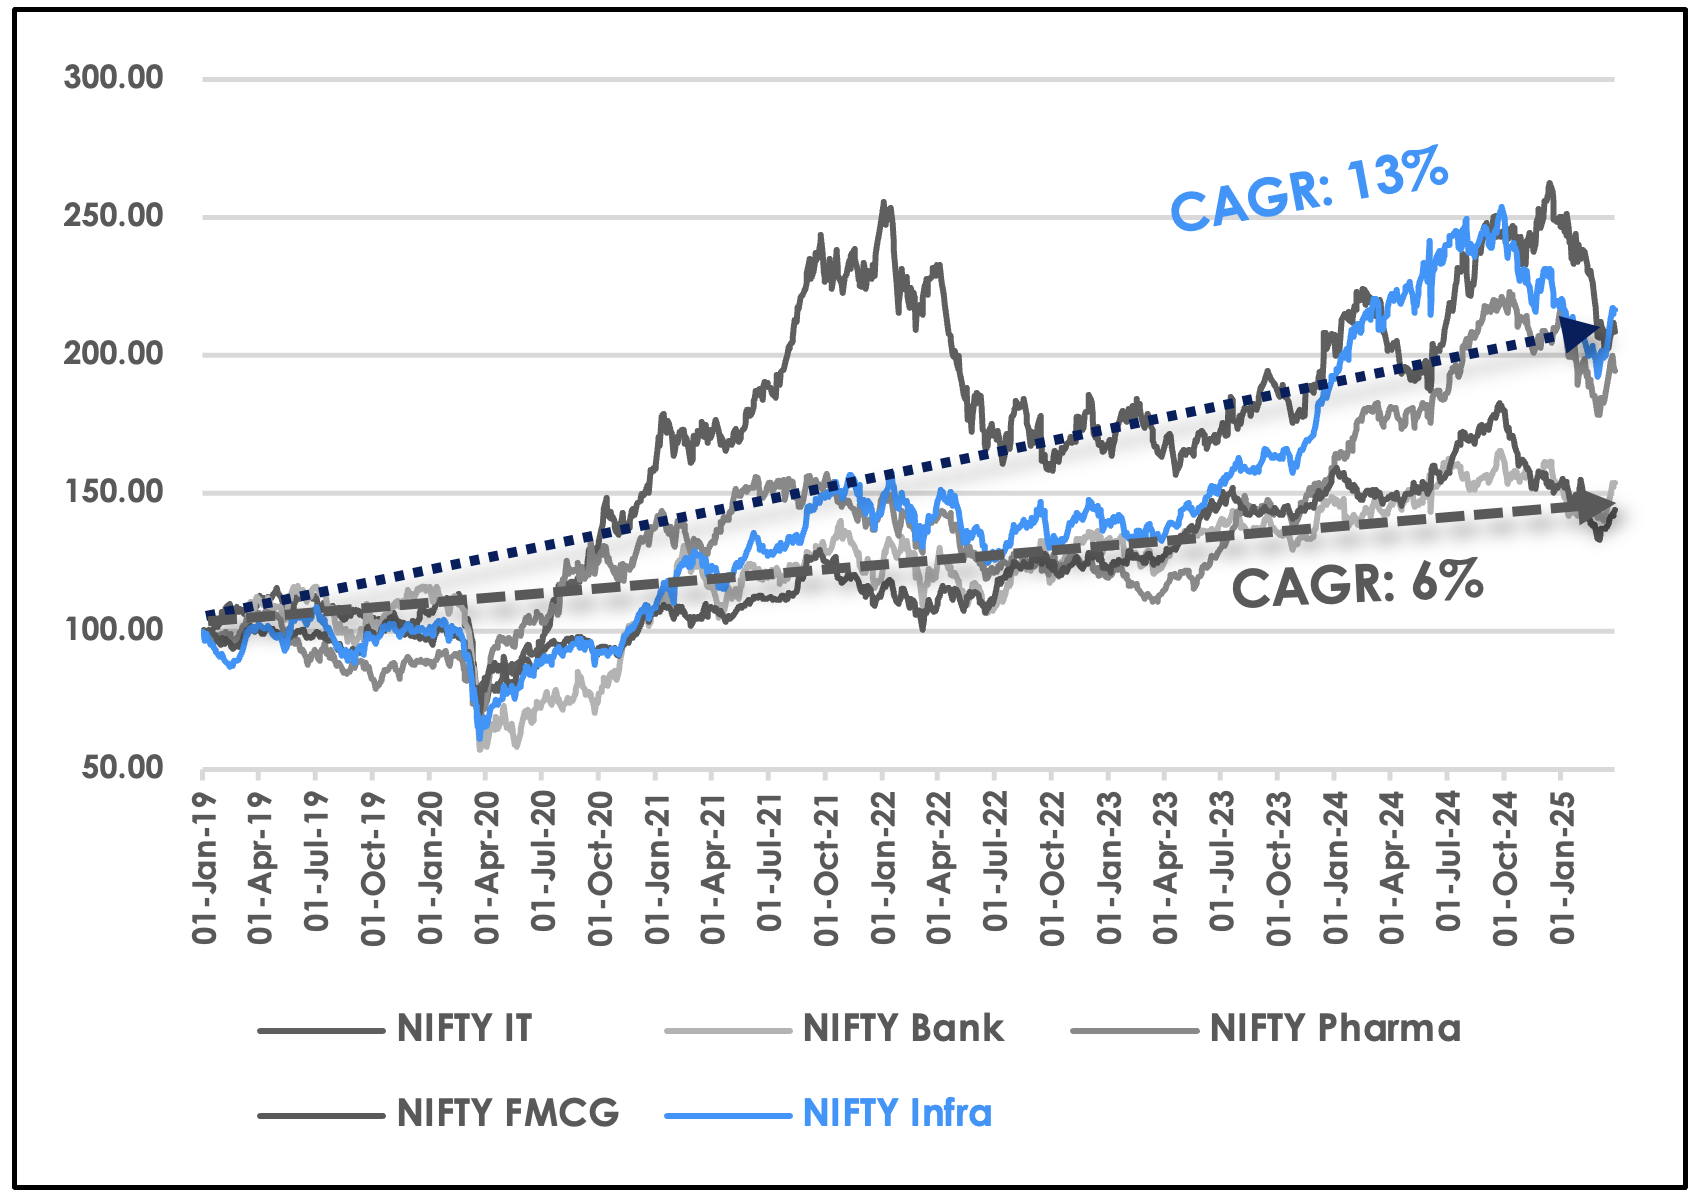
Sectoral Performance (6 Years) (1st Jan 2019 = 100, USD). Source: Quantwater Analysis
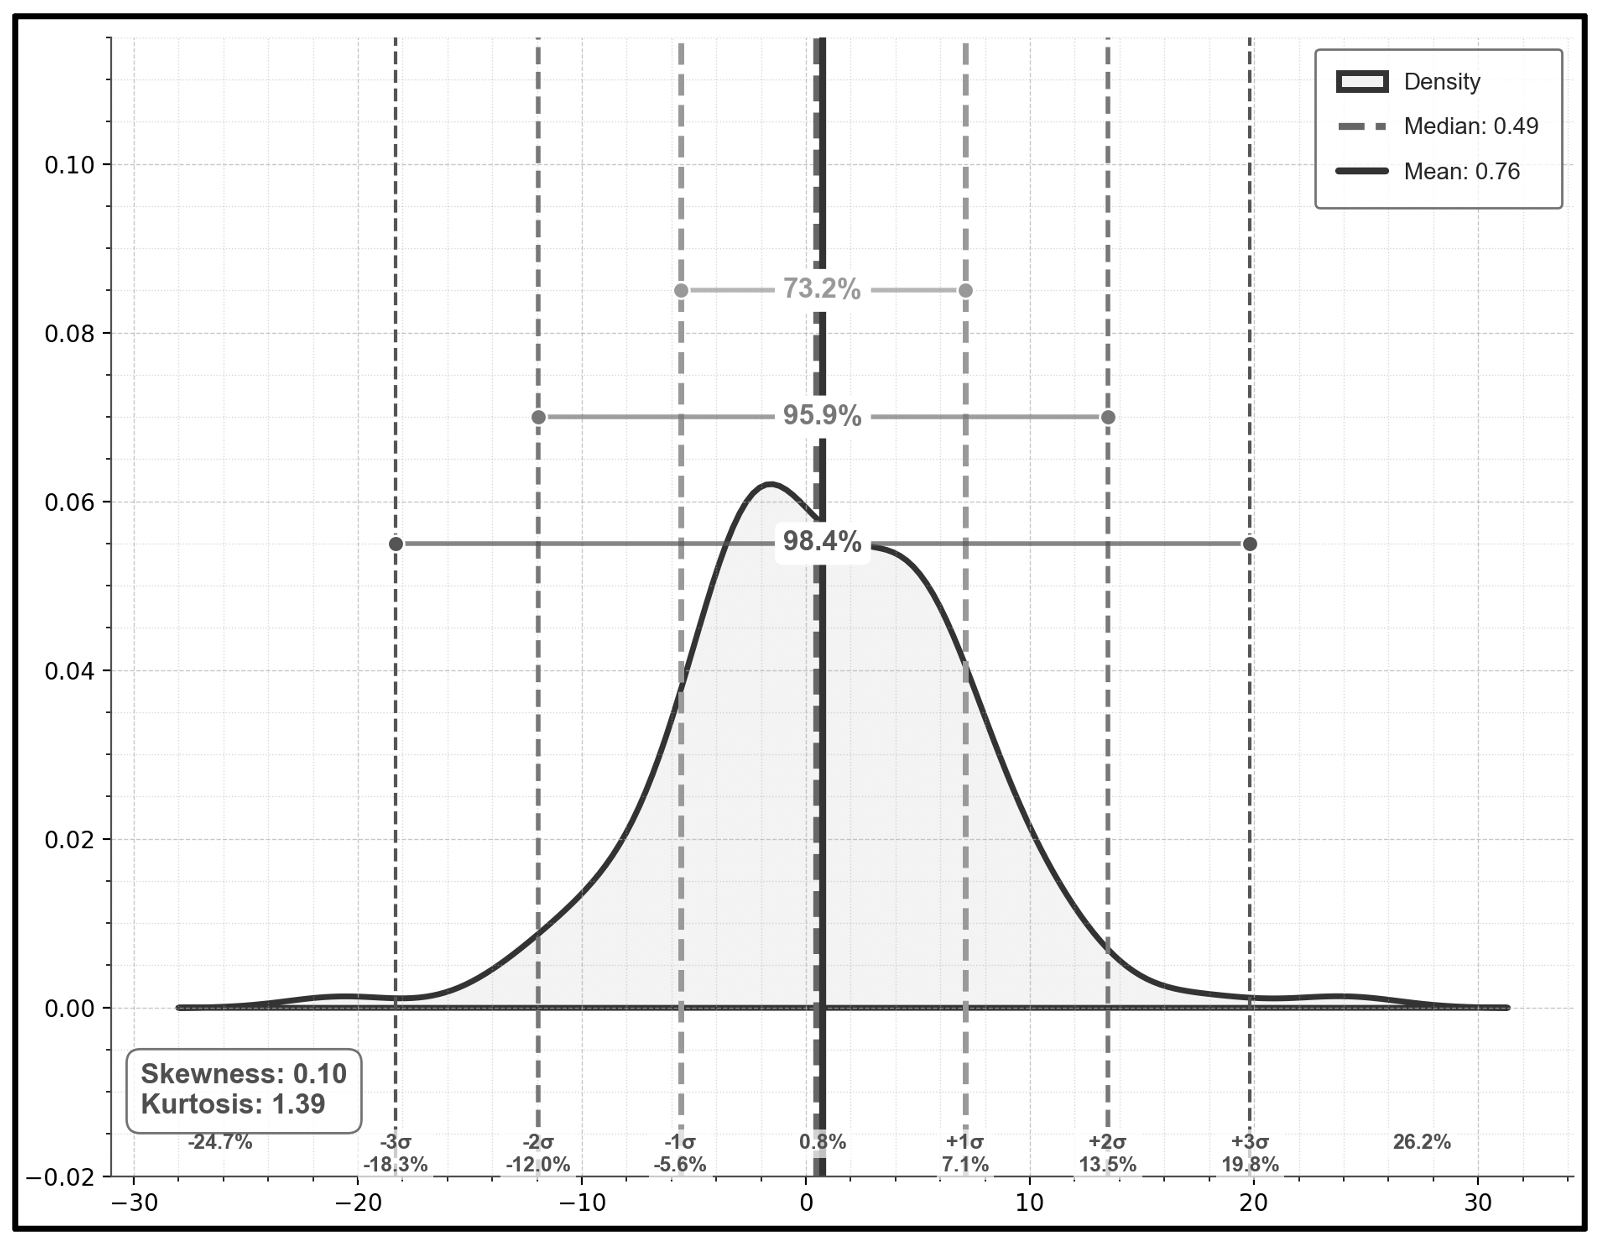
Density Plot Nifty IT (10 Years, monthly returns, USD). Source: Quantwater Analysis
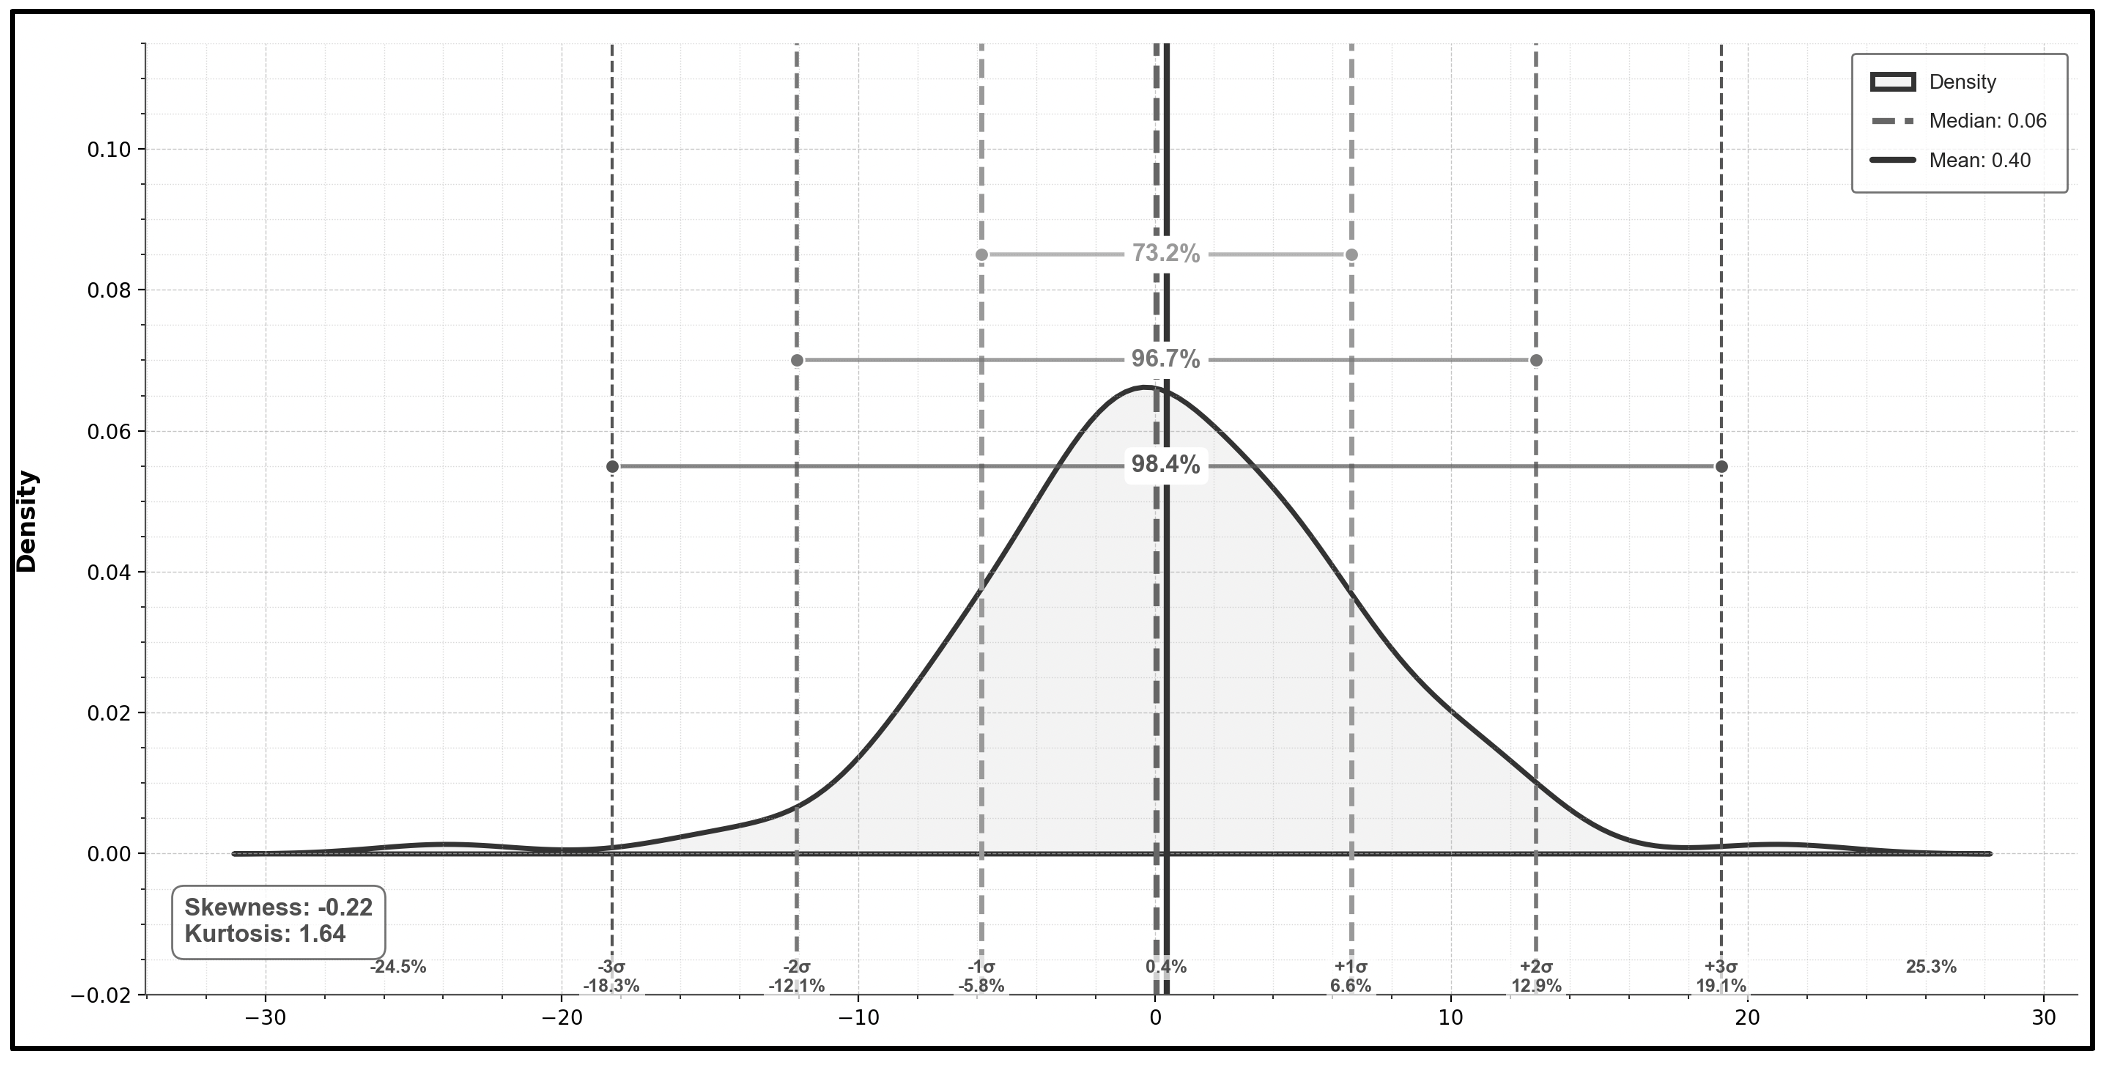
Density Plot Nifty Infra (10 Years, monthly returns, USD). Source: Quantwater Analysis
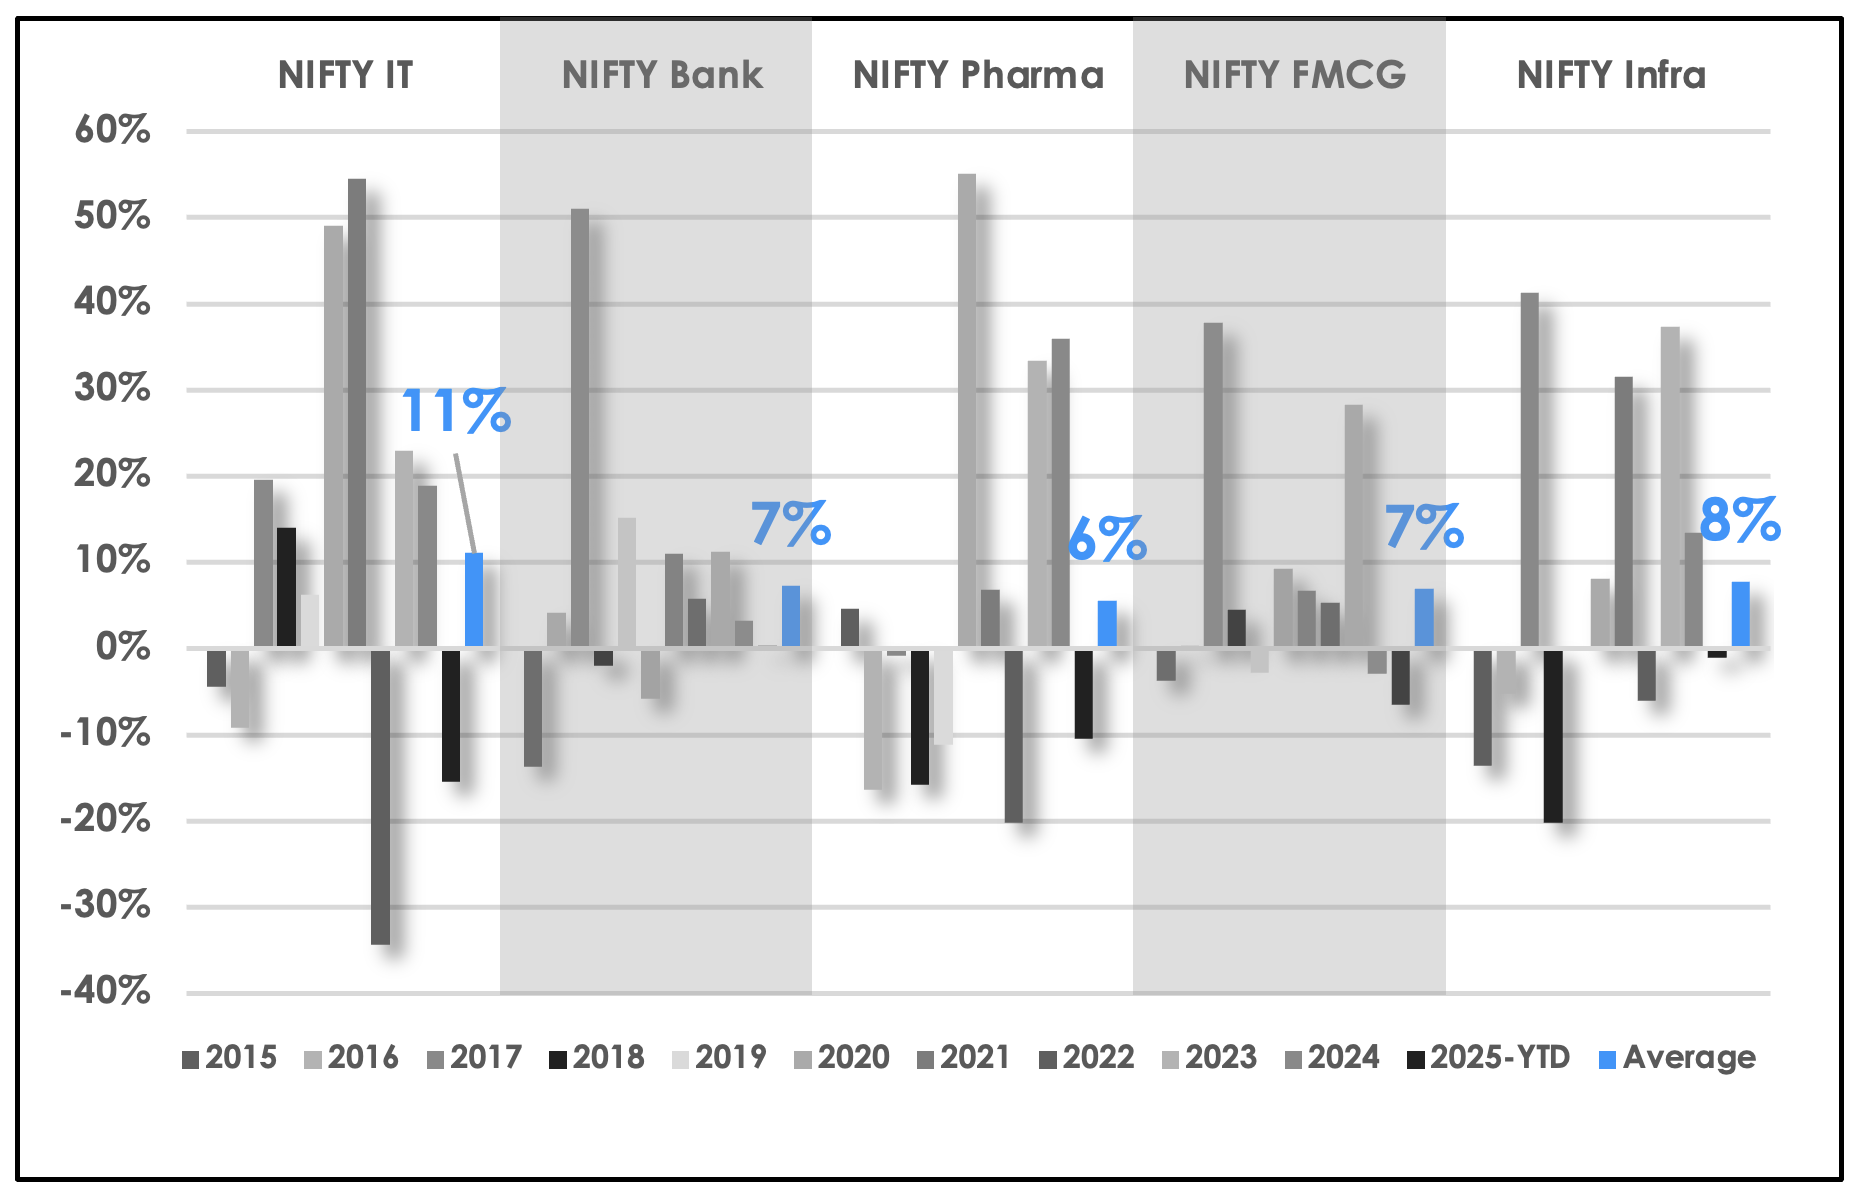
Sector Historical Returns – 10 Years (USD). Source: Quantwater Analysis
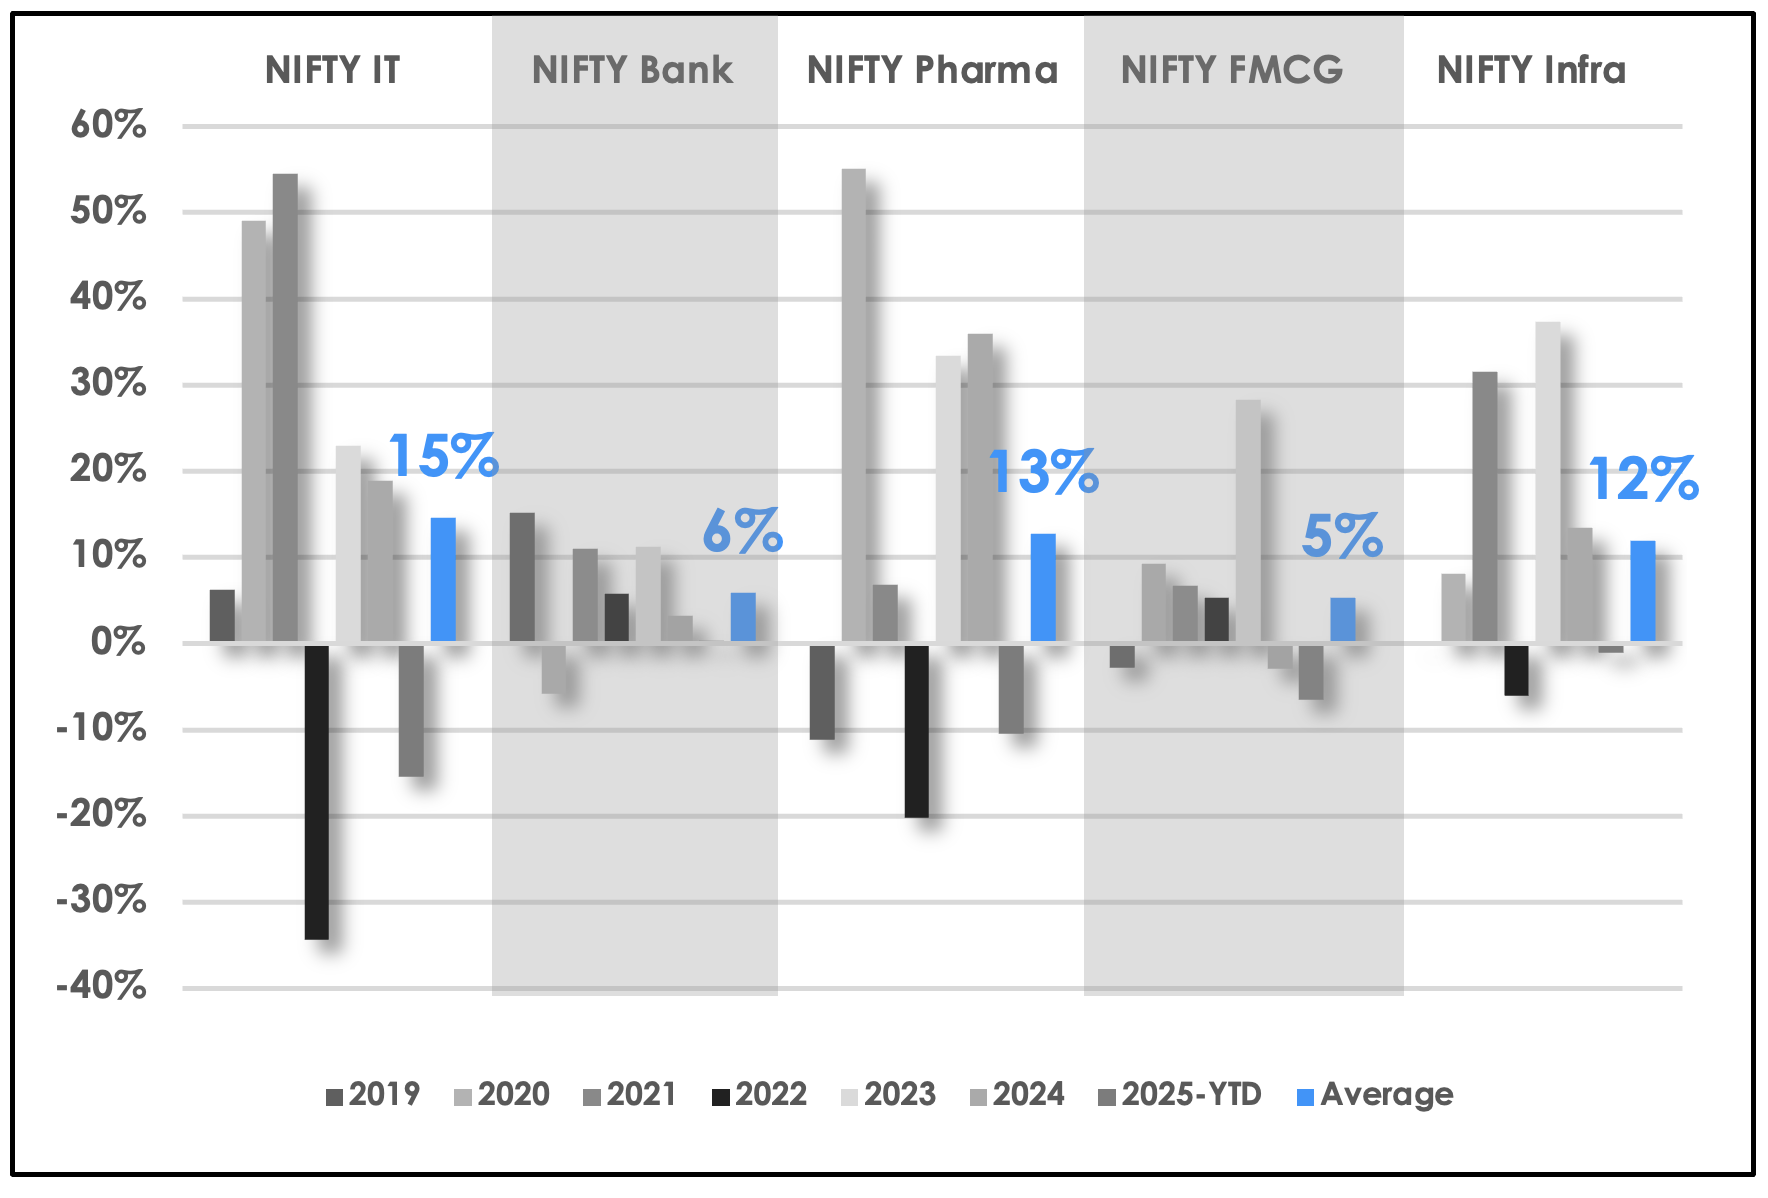
Sector Historical Returns – 6 Years (USD). Source: Quantwater Analysis
Volatility - USD Terms
When viewed in USD, market volatility reflects both domestic dynamism and the typical interplay of exchange rates common in global investments, offering a comprehensive picture for international participants.
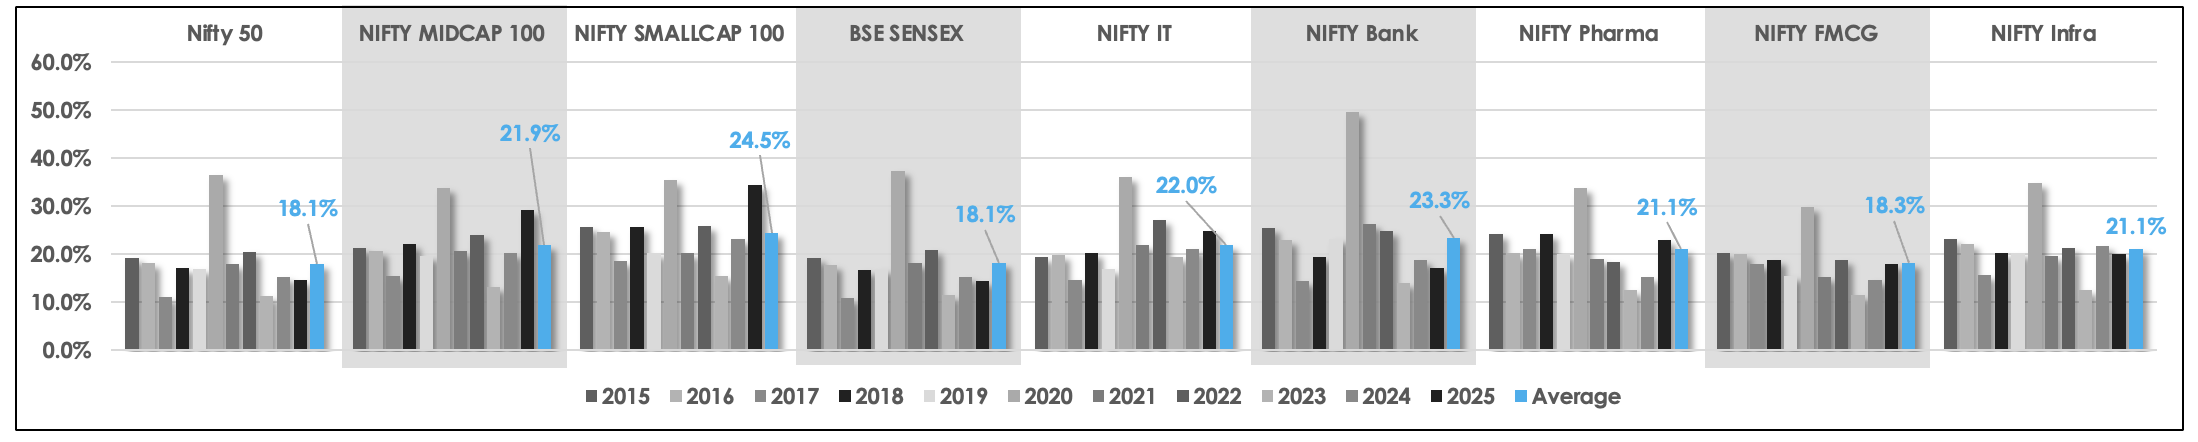
Annualized Volatility - Indices & Sectors (USD). Source: Quantwater Analysis
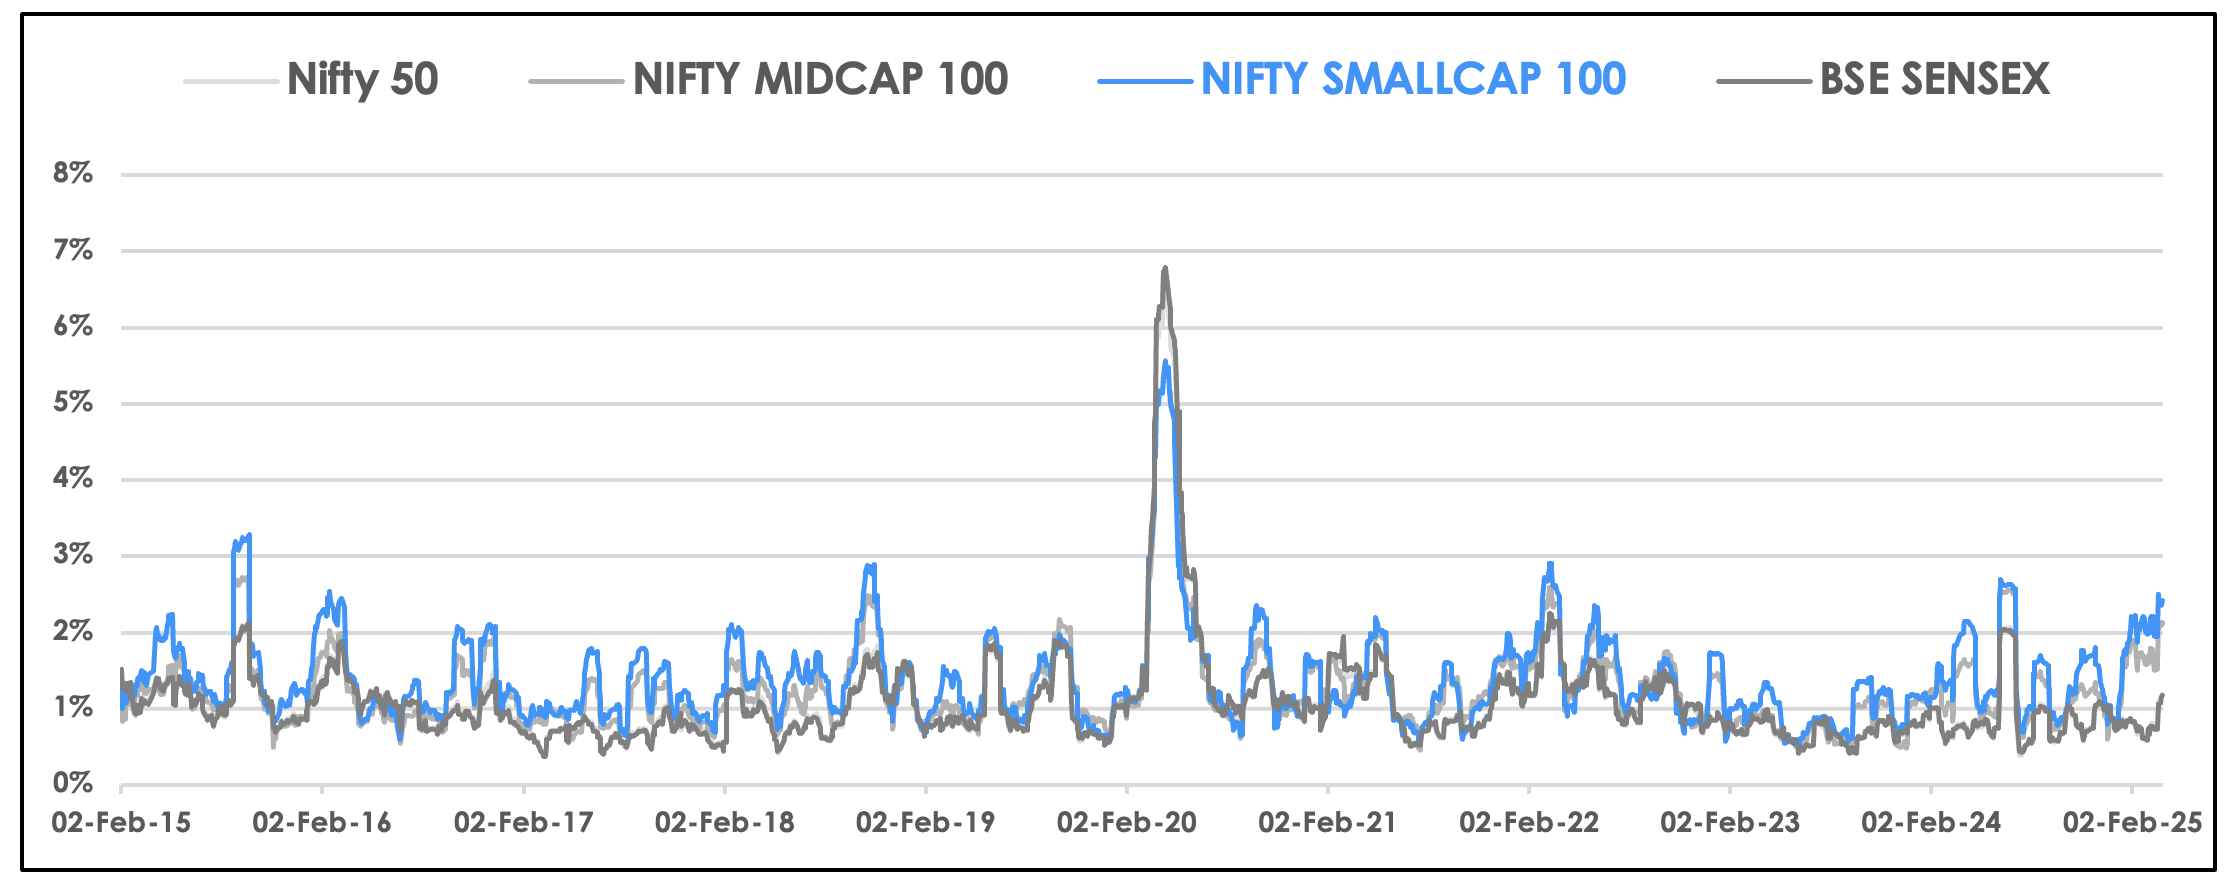
Rolling Volatility (1 month) - Indices (USD). Source: Quantwater Analysis
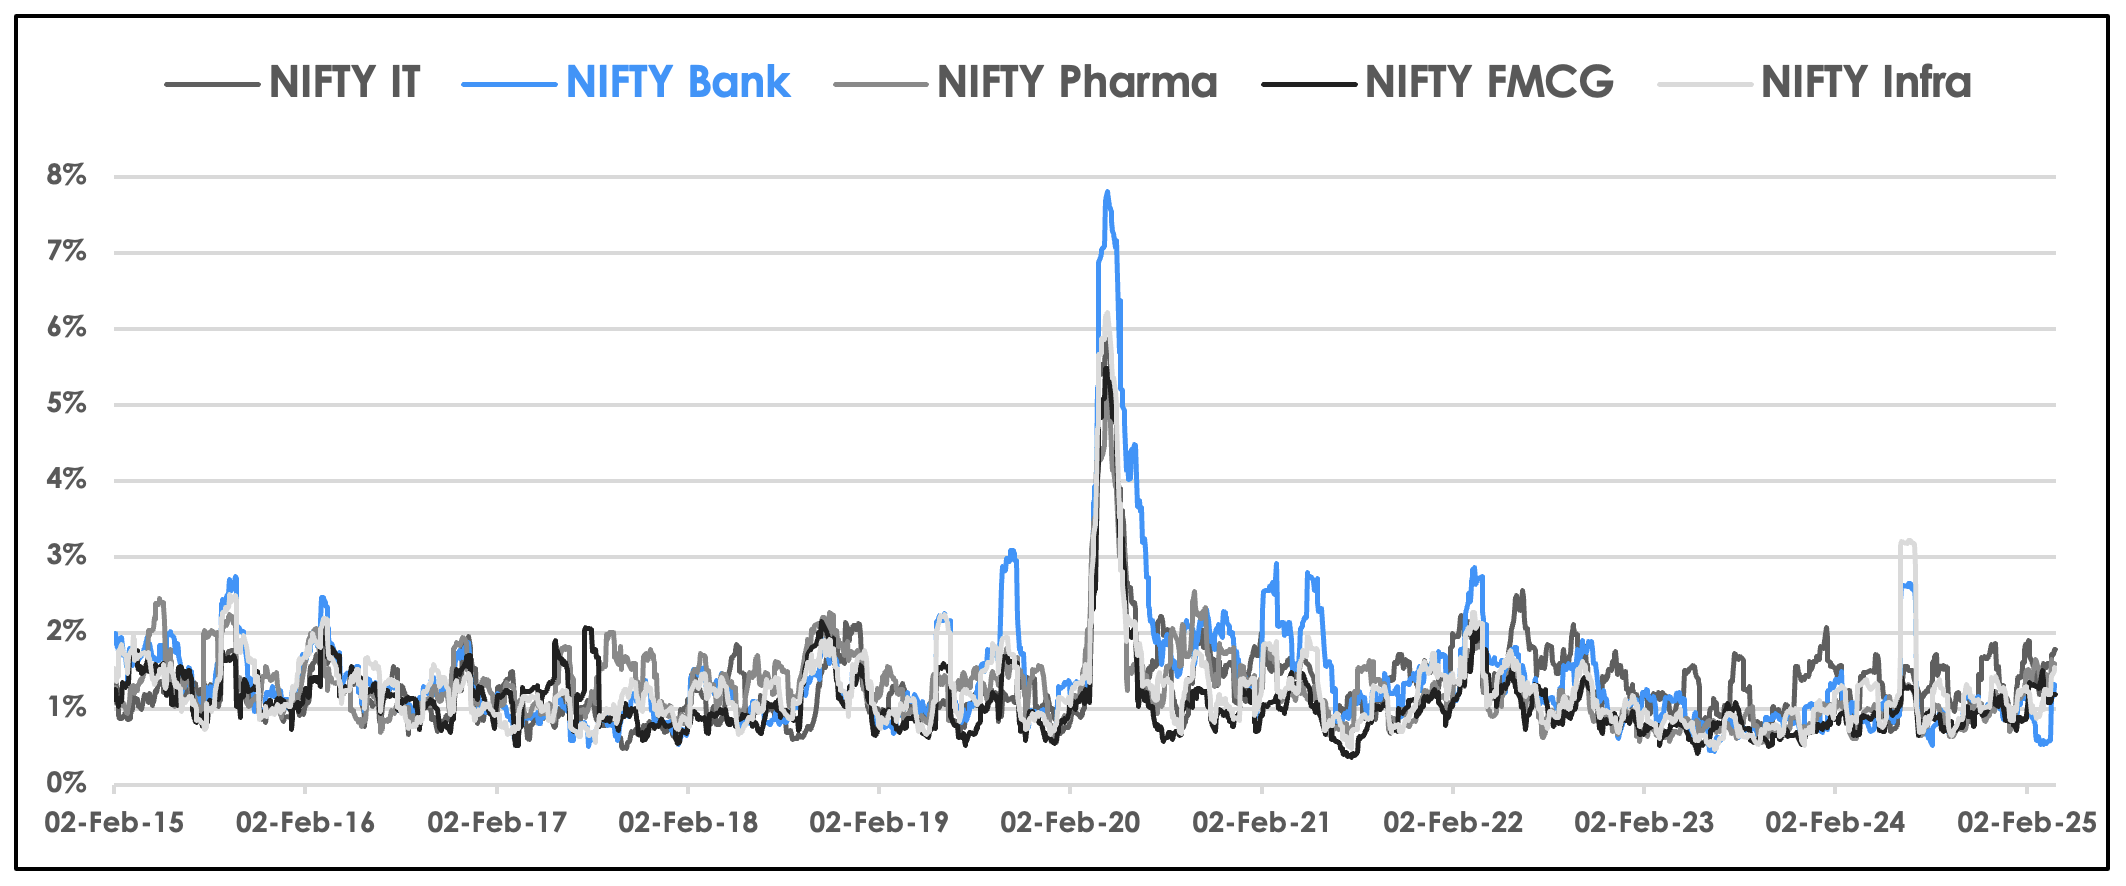
Rolling Volatility (1 month) - Sectors (USD). Source: Quantwater Analysis
Fixed Income Landscape - Government Bonds
The Indian fixed income market presents attractive opportunities, particularly in government securities (G-Secs) and corporate bonds. The G-Sec yield curve, currently upward sloping, positively signals strong growth expectations. Moreover, the significant spread between G-Secs and US Treasuries offers compelling relative value.
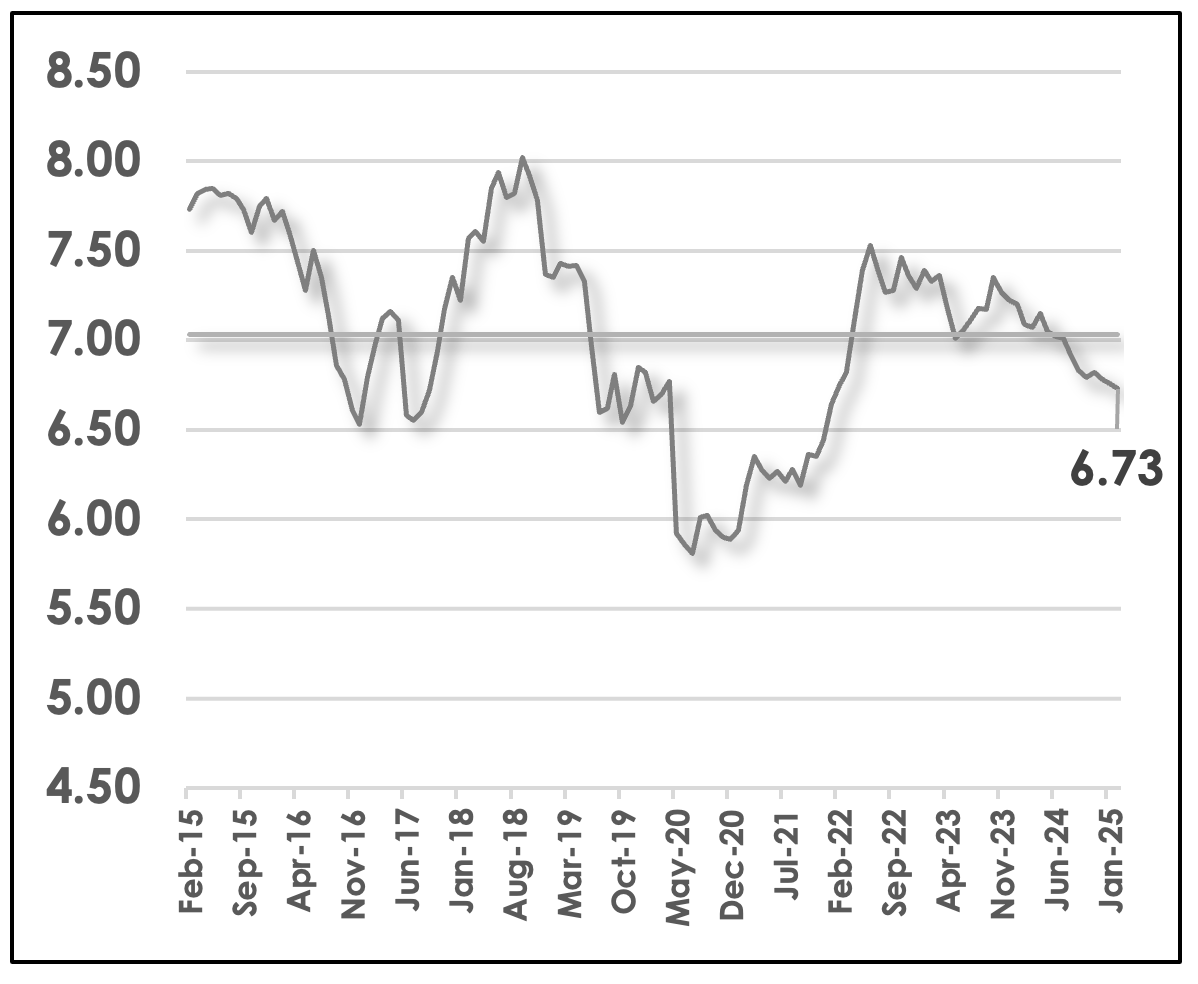
10Y G-Sec Yield %. Source: Quantwater Analysis
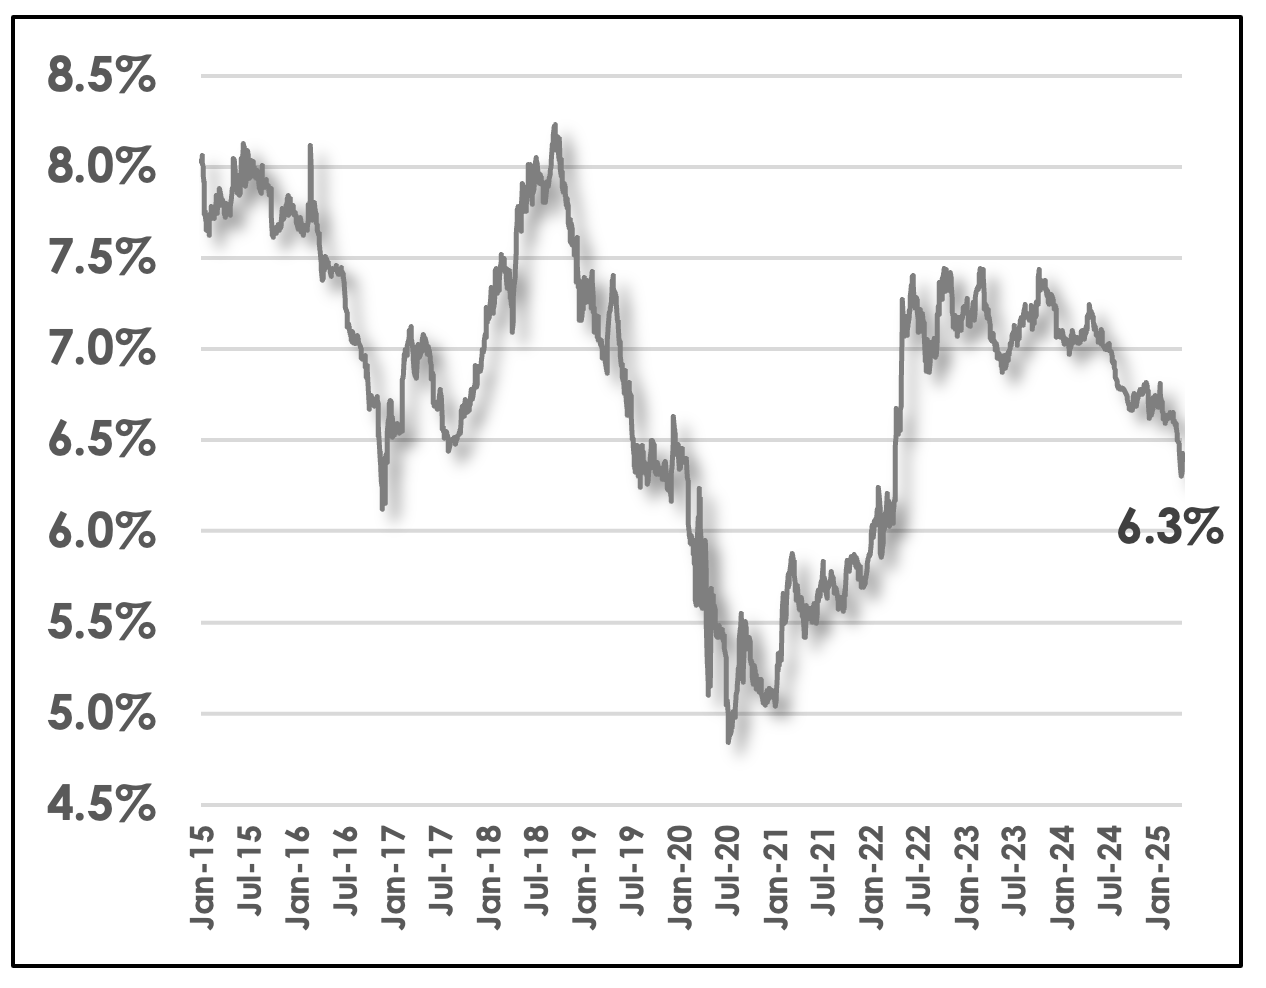
5Y G-Sec Yield %. Source: Quantwater Analysis
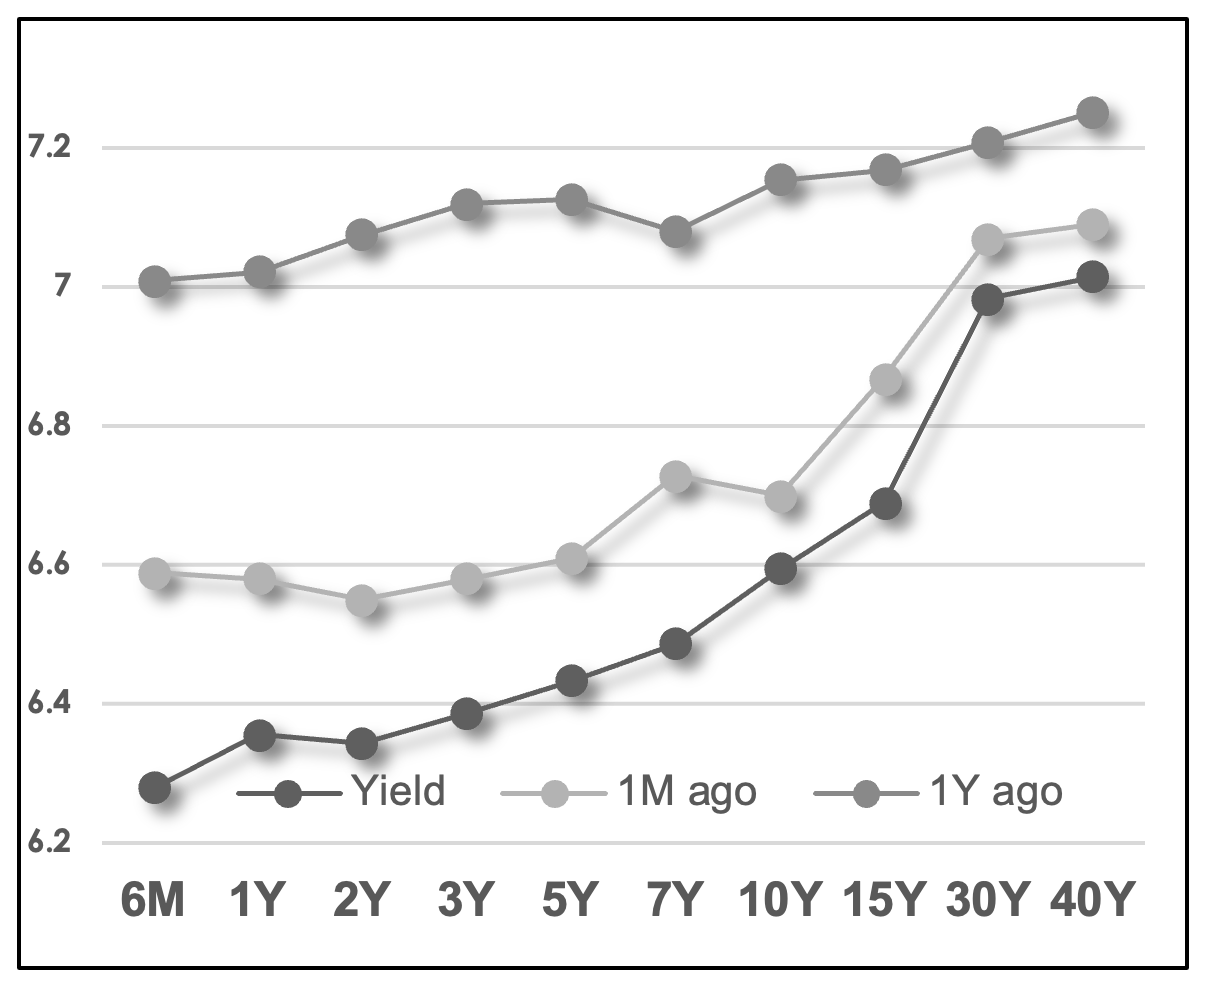
Yield Curve: Normal positive slope maintained, suggesting exciting growth expectations. Source: Quantwater Analysis
OMO – Impact of RBI bond purchases:
- RBI conducts Open Market Operations (OMOs) by purchasing/selling government securities in the secondary market to skillfully regulate money supply and manage long-term interest rates.
- In April 2025, RBI announced plans to purchase ₹80,000 crore of G-Secs across four ₹20,000 crore tranches (April 3, 8, 22, 29) to enhance market liquidity, showcasing its proactive stance.
- The first auction saw strong demand for mid-to-long dated securities, with the 8.24% GS 2033 receiving the highest allocation (₹7,660 crore), indicating market confidence.
- These operations effectively support the positive yield curve slope and brilliantly demonstrate RBI's proactive and adept management in maintaining orderly market conditions, even as the global interest rate environment evolves.
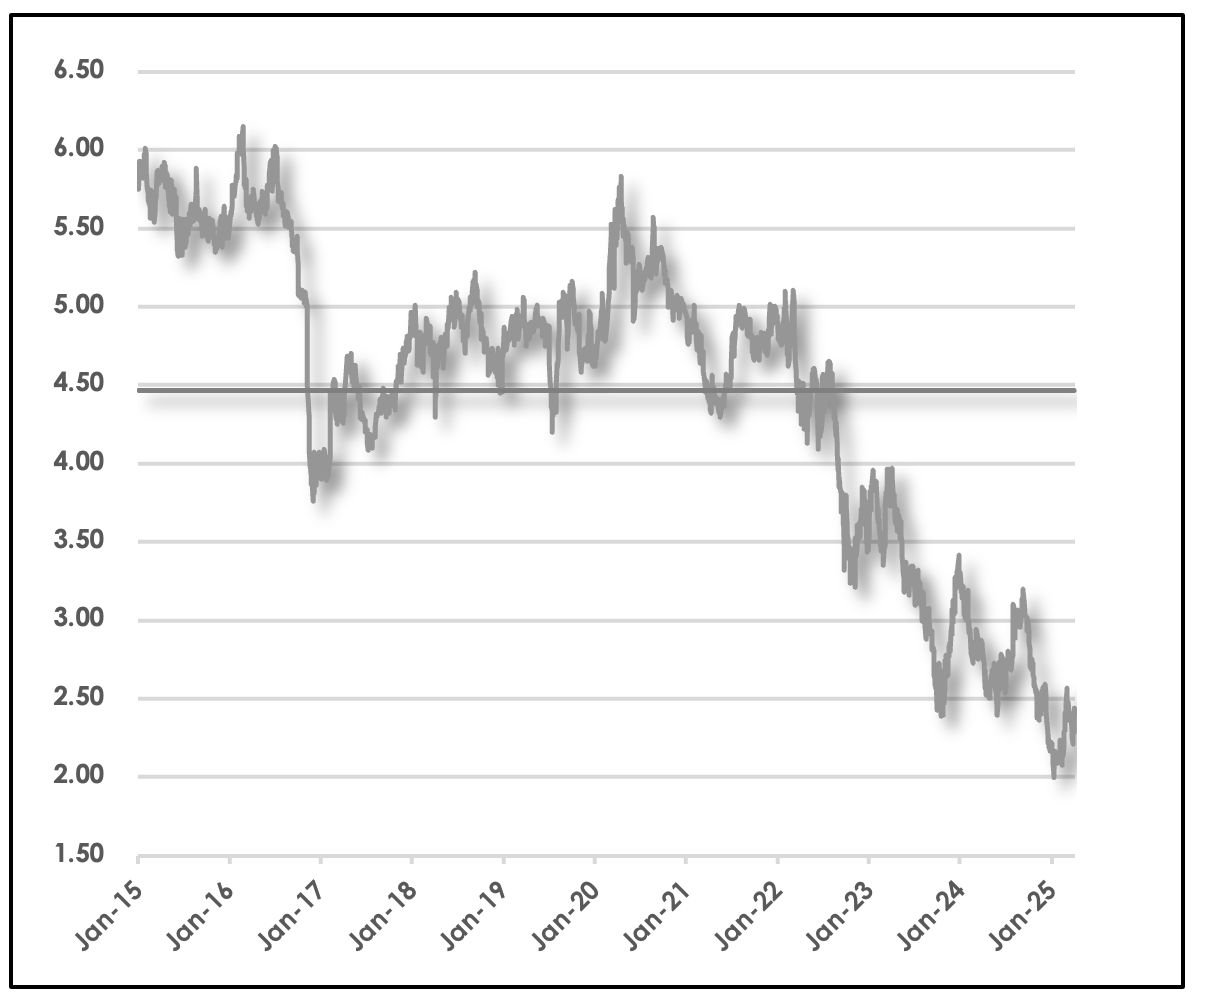
India-US 10Y Yield Spread: Average spread is an attractive 4.5% over last 10 years. Source: Quantwater Analysis
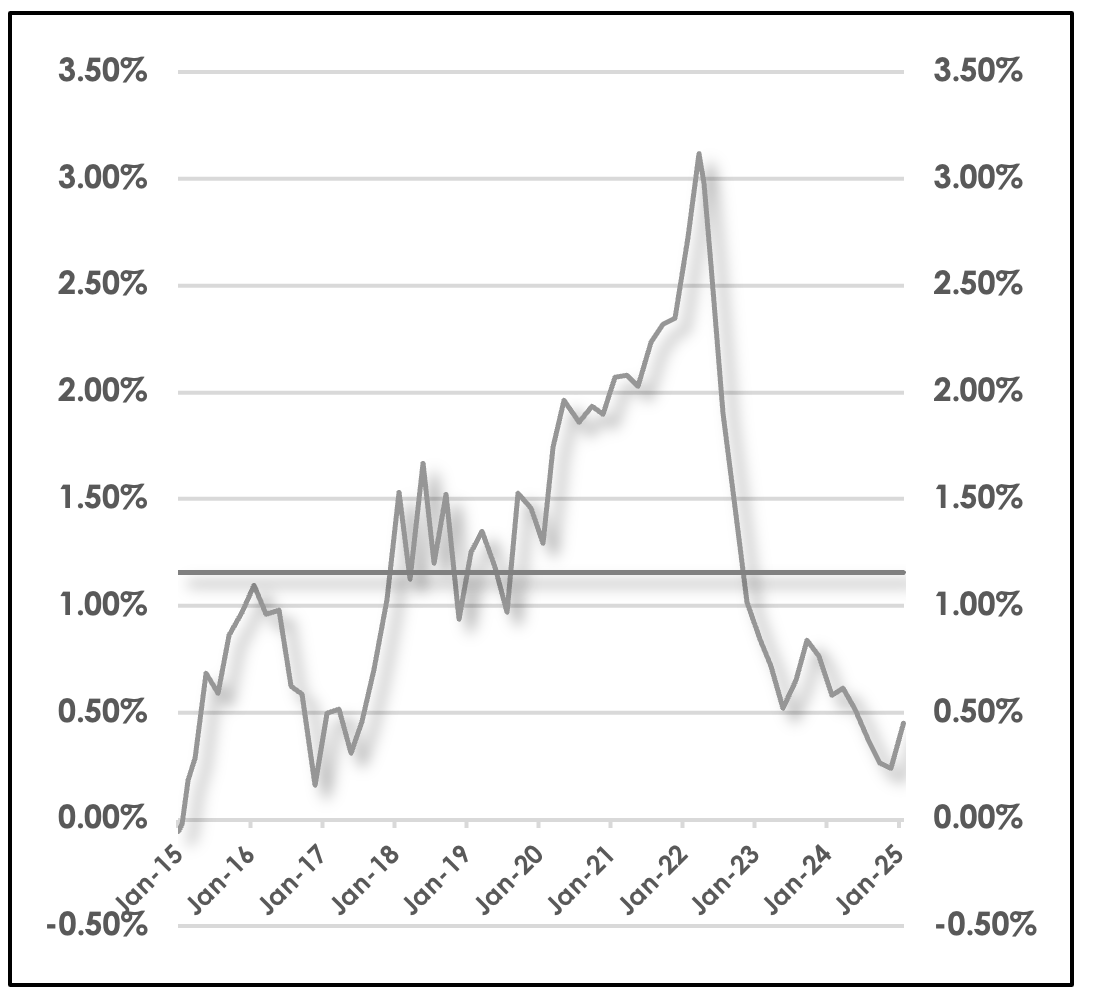
10Y G-Sec - Repo Rate Spread: Average spread is a healthy ~1.0% over last 10 years. Source: Quantwater Analysis
Fixed Income Landscape - Corporate Bonds
The corporate bond market is also thriving, with credit spreads reflecting a healthy landscape where upgrades are generally outpacing downgrades – a clear indicator of robust corporate financial health.
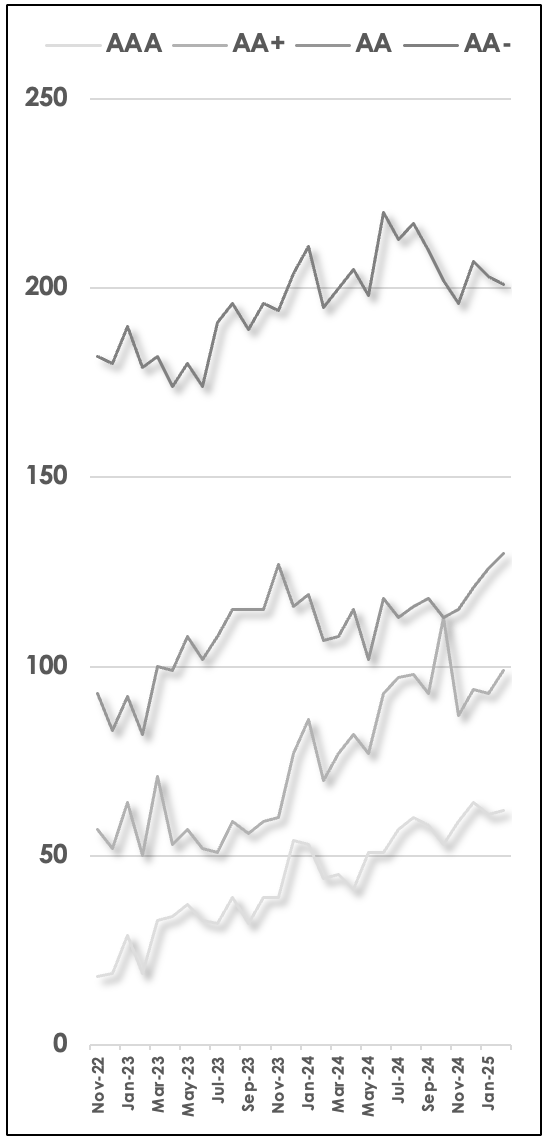
Spread Over 5Y G-Sec yields (bps). Credit spreads offer attractive compensation for credit risk. Source: Quantwater Analysis
Fixed Income Landscape - FDs & Debt Mutual Funds
For retail investors, Fixed Deposits and Debt Mutual Funds (including Gilt, Corporate Bond, and Short Duration funds) offer accessible and popular avenues for investment. In the current environment, focusing on real returns provides a smart strategy to grow wealth.
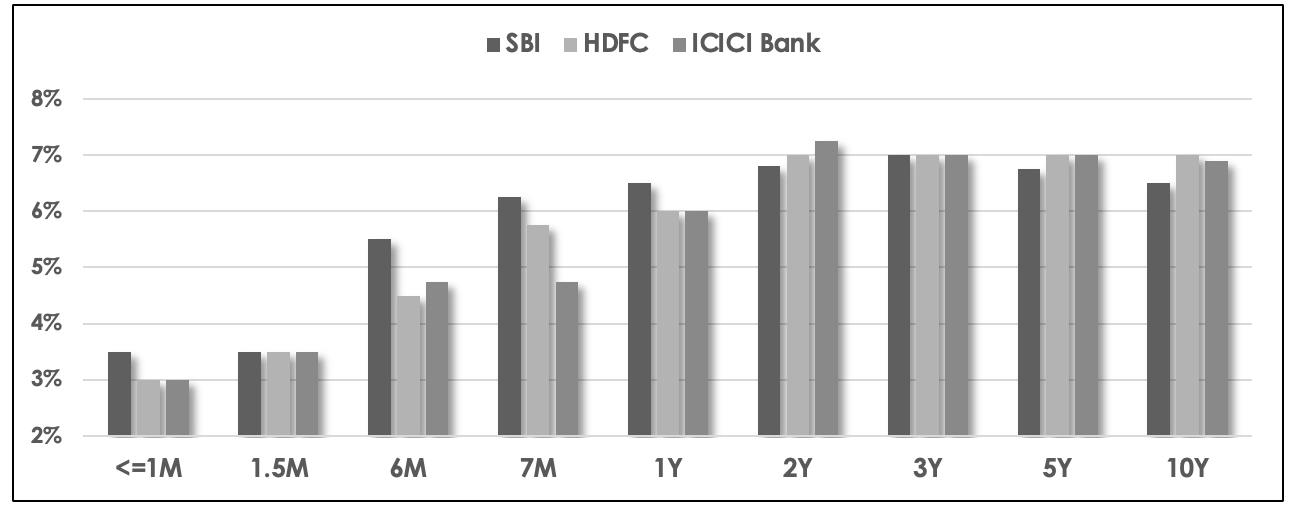
FD Interest Rates. Source: Quantwater Analysis
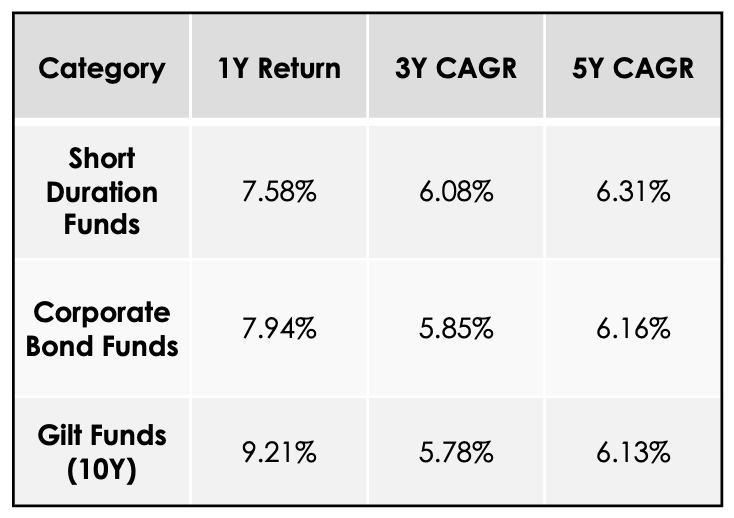
Debt MF Returns (e.g., Gilt Funds). Source: Quantwater Analysis
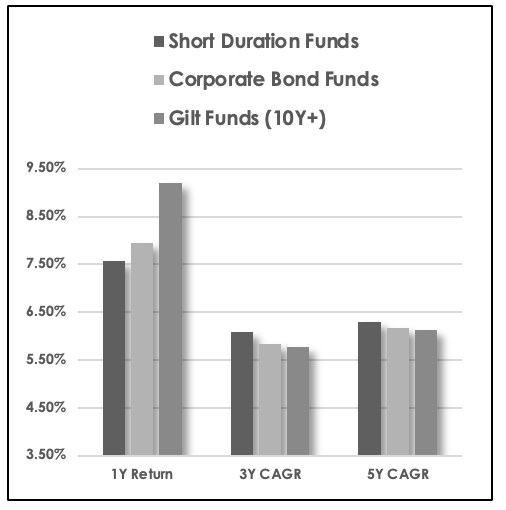
Debt MF Returns (e.g., Short Duration). Source: Quantwater Analysis
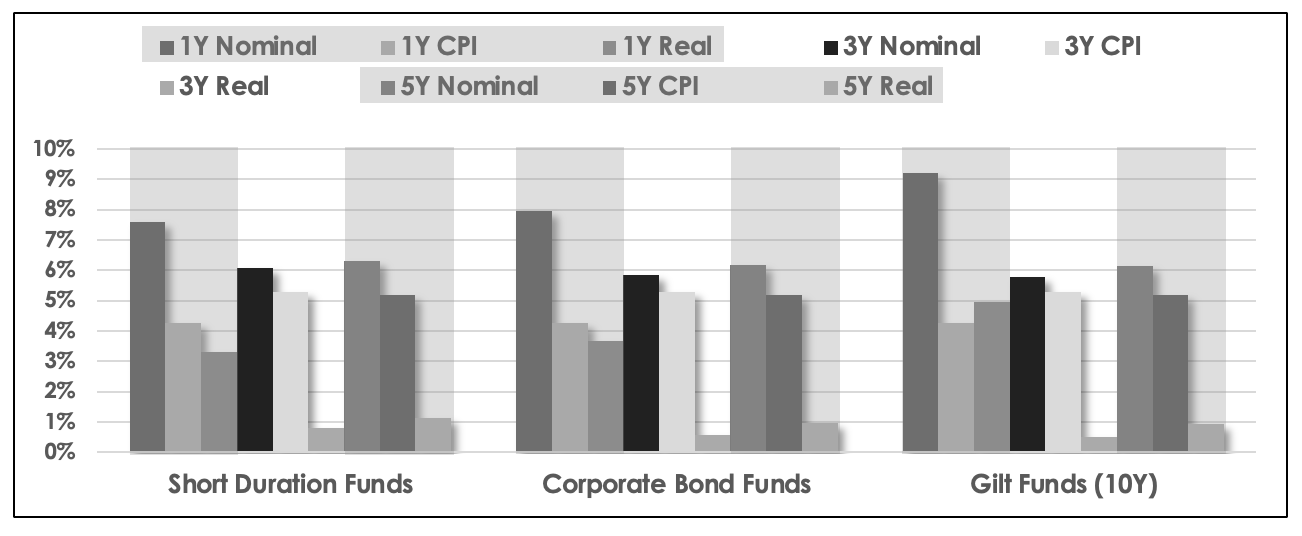
CPI Inflation vs Returns (Real Return View). Source: Quantwater Analysis
Foreign Investment & Currency
India continues to shine as a magnet for Foreign Direct Investment (FDI), particularly in Services, Computer Hardware/Software, and Manufacturing. Demonstrating remarkable resilience, FDI flows have remained impressively stable, even amidst the backdrop of global uncertainties. Foreign Institutional Investor (FII) flows into equity markets, while naturally more dynamic and responsive to global sentiment and interest rate shifts (such as US Fed actions), reflect India's integral role in the global financial ecosystem. This responsiveness is typical for sought-after emerging markets. The INR/USD exchange rate has experienced a gradual, managed depreciation over the long term, a common characteristic for rapidly growing economies balancing global trade, capital flows, and commodity prices (like oil). This managed movement often supports export competitiveness.
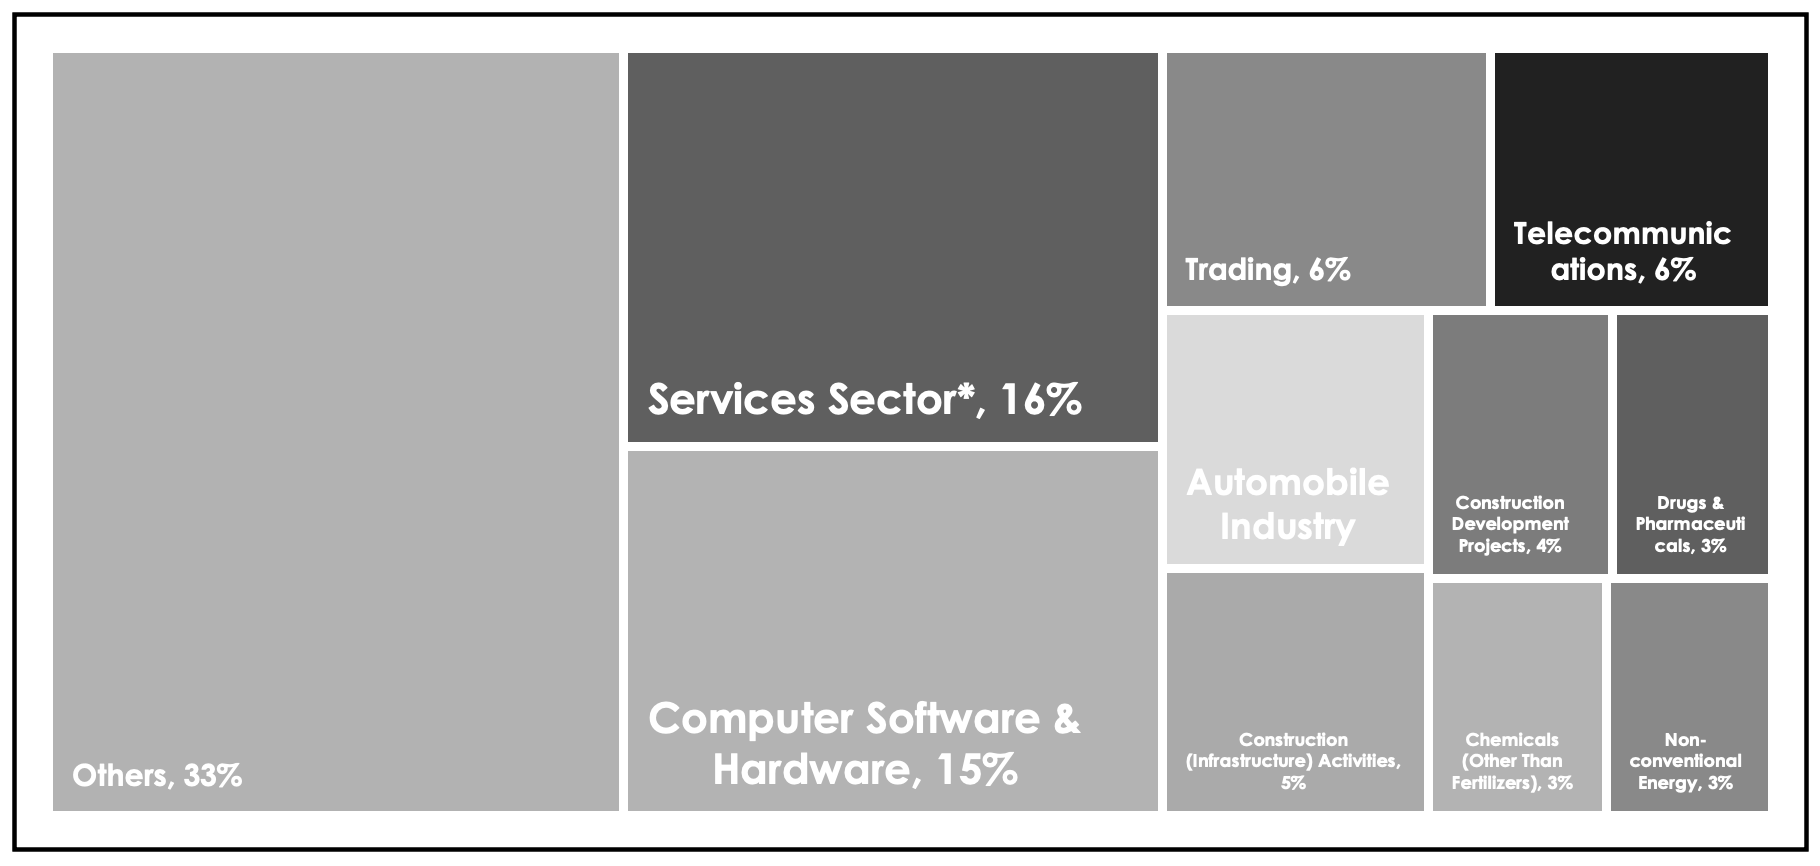
FDI Sectoral Inflow (Apr 2000 - Dec 2024). Total: USD 720B. Source: DPIIT
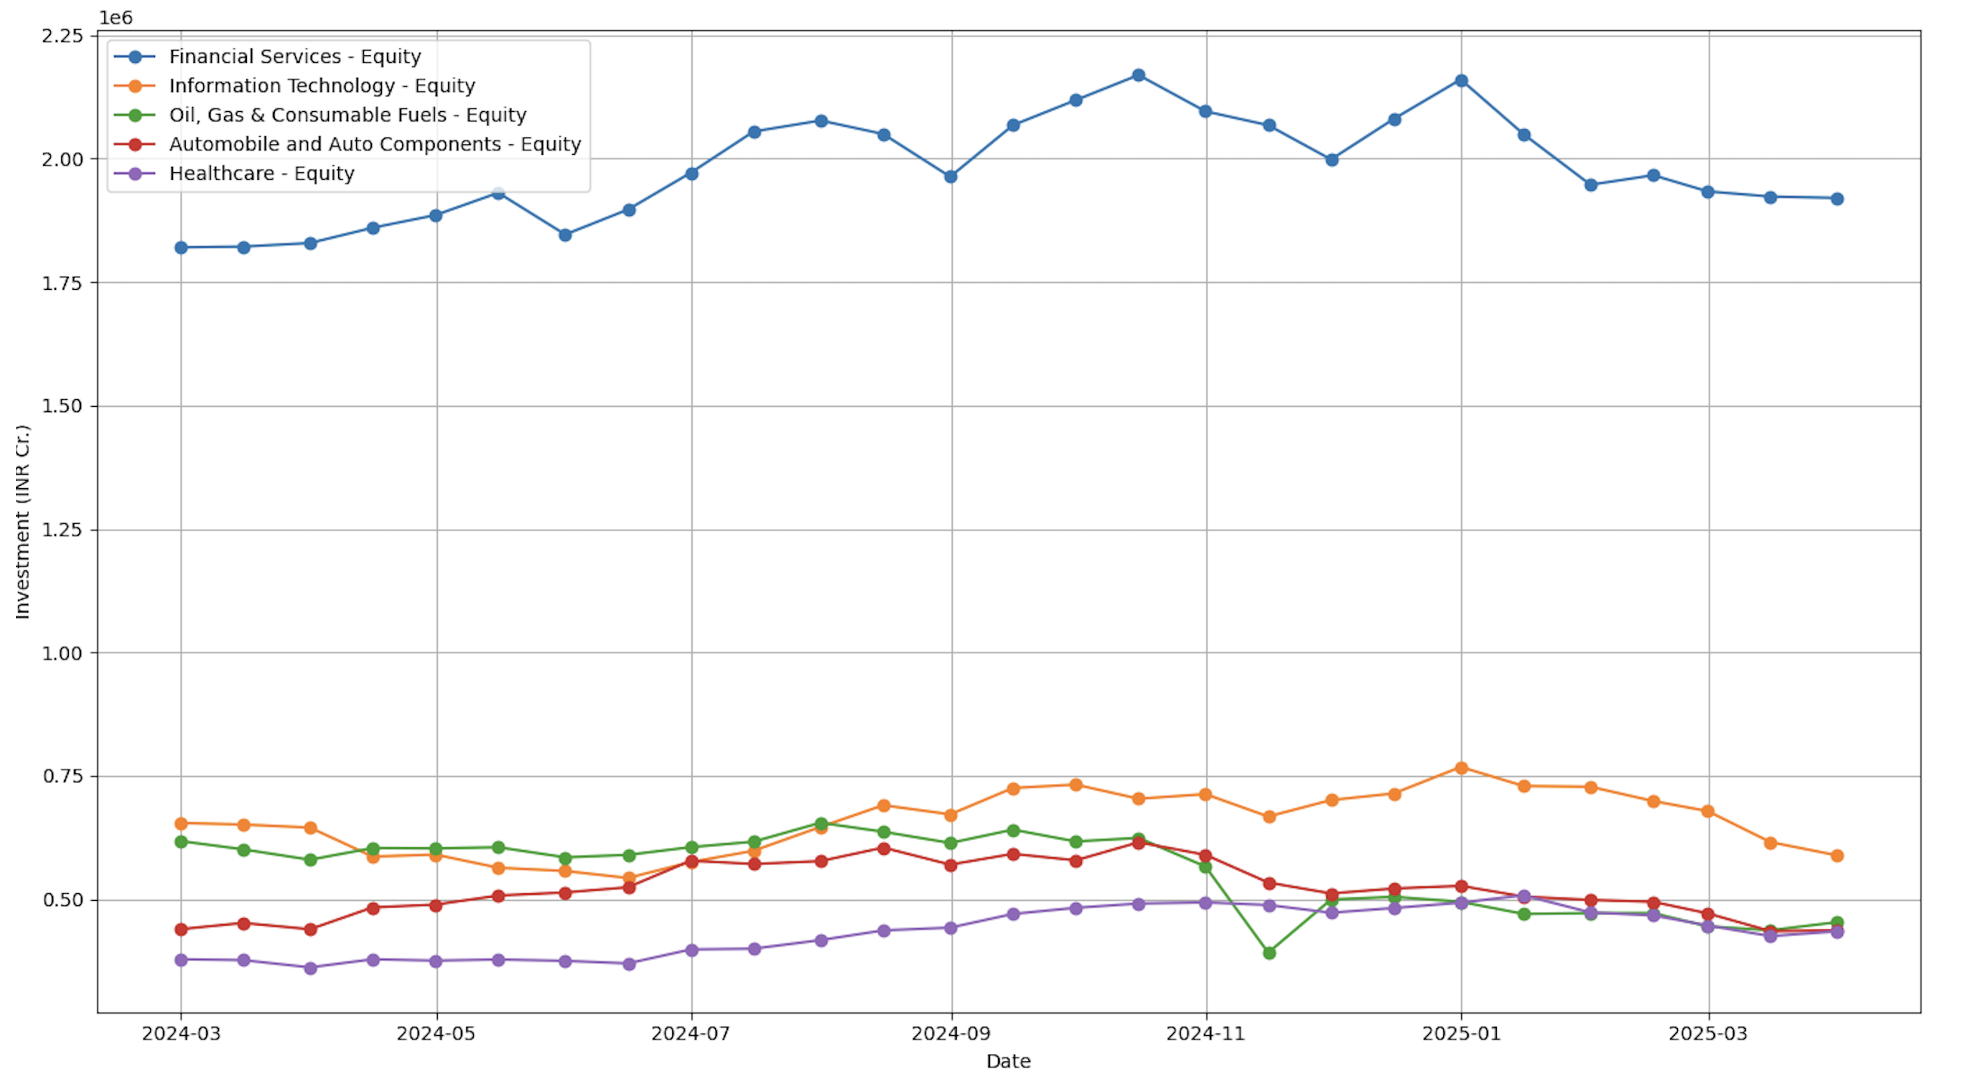
FII Flows - AUC. Source: Quantwater Analysis
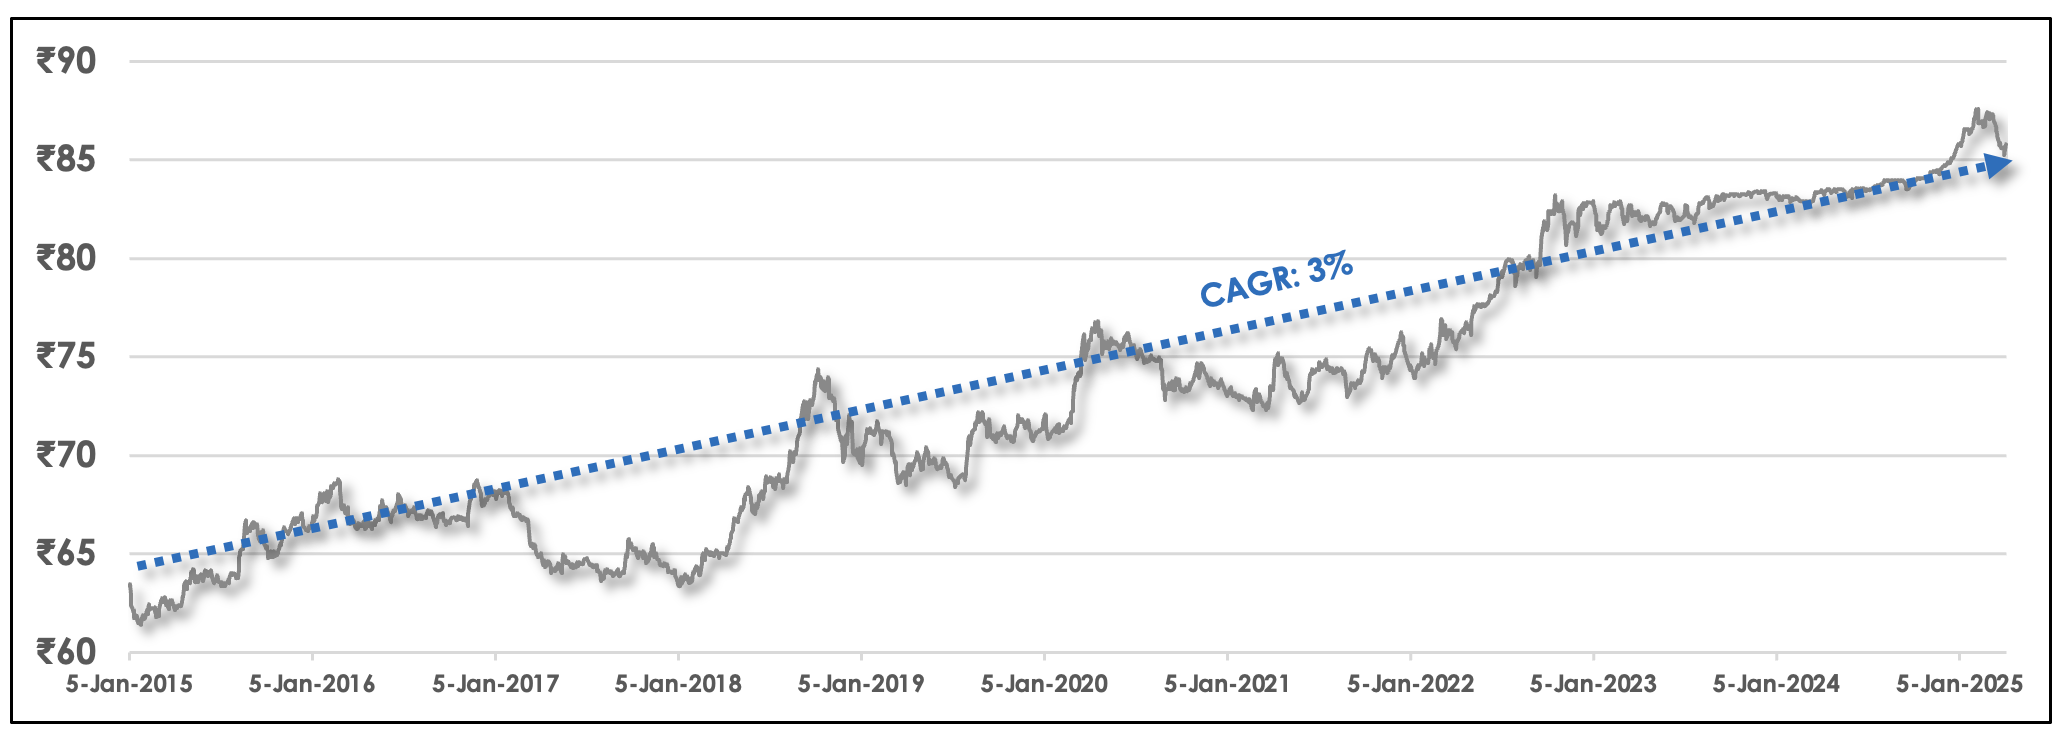
INR/USD Exchange Rate. CAGR 3% over last 10 years. Source: Quantwater Analysis
Emerging Sectors & Opportunities
The excitement truly builds when we look beyond traditional sectors! India is a hotbed for emerging industries bursting with high-growth potential, supercharged by cutting-edge technological advancements and visionary policy support:
- Artificial Intelligence (AI): A rapidly growing market (an astounding $17B projected by 2027), strongly supported by government missions and world-class research centers.
- Electric Vehicles (EV) & Renewable Energy: Phenomenal CAGR in EVs, significant renewable capacity addition (especially solar), backed by forward-thinking policies like FAME II and PLI schemes.
- Digital Payments & FinTech: Explosive growth in UPI transactions, with a burgeoning FinTech ecosystem valued potentially over an incredible $150B by 2025.
- Advanced Manufacturing: Boosted by transformative PLI schemes in electronics, semiconductors, pharma, and textiles, positioning India as a key “China+1” global manufacturing hub.
- Digital Public Infrastructure: Groundbreaking platforms like UPI, Aadhaar, and ONDC enabling large-scale innovation and citizen empowerment.
India stands at the thrilling cusp of a monumental tech-industrial transformation, propelled by a strong policy push, favorable global realignments, and world-class digital infrastructure as key tailwinds. These vibrant sectors are set to dominate investment conversations and drive exceptional growth in the coming years.
Risks & Considerations: Navigating the Path Forward
While the Indian growth story is incredibly compelling, like all dynamic emerging economies, it's prudent to be aware of certain external factors and common growth-related considerations that could influence the journey:
- External Economic Climate: Like many globally integrated economies, shifts in major economic blocs like the US/EU could influence export and investment trajectories. This is a common consideration for nations participating actively in global trade.
- Global Geopolitical Landscape: International events and trade dynamics, which are outside any single nation's control, can introduce volatility, particularly in commodity markets (like oil). Navigating these global currents is a shared experience for emerging markets.
- Inflation Management Dynamics: Managing inflation is an ongoing focus for most high-growth economies globally. Should inflationary pressures, often influenced by international factors, persist more than anticipated, the RBI, like other central banks, is well-equipped to adjust its stance. India's proactive approach to balancing growth with price stability is a key strength.
- International Monetary Policy Shifts: Decisions by major global central banks (e.g., Fed, ECB) naturally influence international capital flows. This is a standard feature of interconnected financial markets and a common factor for emerging economies attracting global investment, reflecting their integration into the world economy.
- Evolving Global Regulatory Standards: Across the world, there's a healthy and necessary evolution in tech and crypto regulations, with global momentum around tech regulation intensifying, particularly in disinformation and data privacy — a necessary shift in response to increasing misuse regarding exploitation of personal information and abuse, responsible AI, market integrity and ethics. India is proactively aligning with these global best practices to foster sustainable innovation and build a trusted digital ecosystem – a positive step that enhances long-term growth prospects in these cutting-edge sectors.
Conclusion: Embracing the India Opportunity with Confidence
India shines as an exceptionally compelling long-term investment destination, powered by robust macroeconomic fundamentals, advantageous demographics, continuous structural reforms, and a vibrant, rapidly expanding digital economy. Its remarkable resilience, especially in the face of global uncertainties, powerfully underscores the strength of its domestic market and the astuteness of its policy framework.
A universe of exciting opportunities awaits across diverse sectors, particularly those benefiting from the digital transformation, infrastructure development, green energy transition, and advanced manufacturing push. India's capital markets offer the prospect of attractive returns in both INR and USD terms, and like all thriving markets, exhibit a natural dynamism influenced by both domestic energy and global trends. The fixed income market provides excellent diversification avenues, with careful attention to inflation and credit spreads offering rewarding prospects.
To fully harness this potential, investors will benefit from acknowledging the external factors and common emerging market characteristics discussed. Navigating the global economic climate, geopolitical shifts, and the evolving regulatory scene (a global phenomenon) with a well-informed and selective strategy will be key.
Overall, the powerful structural drivers fueling India's ascent are firmly in place, painting a bright future. For investors with a strategic long-term vision and a sound approach to navigating dynamic markets, India stands out as a premier opportunity within global market portfolios. Embracing its vibrant energy and navigating its journey with insight will be key to unlocking extraordinary potential.